
一. 什么是交易中的方向性变化?
交易中方向变化通常是指市场行情转变的过程。当我们试图找到金融时间序列中的制度变化时,通常会研究时间序列的分布以寻找这些制度及其相应的变化。除此之外,还有一种方法可以考虑,就是使用方向变化(DC)的概念来检测制度变化。方向变化指标最早由Guillaume等人(1997年)提出。在论文中,他们使用这个指标来找出外汇数据中的模式。这个指标也被称为Zig Zag指标,它与时间序列数据点不同,用于发现制度变化。
要构建方向变化指标,我们需要进行递归过程。假设资产价格的时间序列由黄线表示。我们将”低谷”点称为C,水平轴表示时间。每当市场条件发生变化时,资产价格将出现”向下运行”(AB+BC)或”向上运行”(CD+DE)。向下运行由”下降事件”(AB)和随后的”向下超调事件”(BC)组成。而向上运行由”上升事件”(CD)和随后的”向上超调事件”(DE)组成。在向下运行中,低谷可以被理解为”最后的低点”,通过MIN(当前价格,最后的低点)的公式不断更新。在向上运行中,最后的高点可以通过MAX(当前价格,最后的高点)的公式不断更新。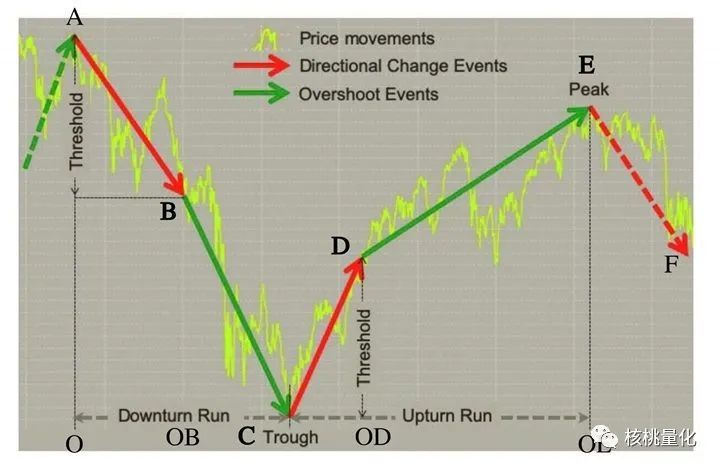
当资产价格相对于最后的低点上升了一定百分比(由交易者任意定义的阈值)时,向下运行结束。在上图中,最后的低点由点C表示,即低谷。红色箭头CD表示向上方向变化事件。低谷点C是确认向下运行结束并开始向上运行的信号。点D处的资产价格被称为向上方向变化的确认点,用于标志向上运行的起点。同样,当资产价格相对于最后的高点下降了一定百分比(由交易者任意定义的阈值)时,我们可以确认向上运行已经结束。在上图中,最后的高点由点E表示,即峰值。一旦资产价格低于峰值减去theta,我们就可以确认从点C到点E发生了向上运行。峰值被认为是向上运行的终点。点F被称为向下方向变化的确认点,用于标志向下运行的终点。
上述内容使得时间定义有所不同。根据上图,时间段可以划分为:
OC:下降运行,包括O和OB之间的时间段,即下降方向变化事件(AB)发生的地方,以及OB和C之间的时间段,即下降超调事件(BC)发生的地方。
C,OE:上升运行,包括C和OD之间的时间段,即上升方向变化事件(CD)发生的地方,以及OD和E之间的时间段,即上升超调事件(DE)发生的地方。
二. 计算交易方向改变指标(DC指标)
为了进行算法交易策略,我们需要使用数学公式来计算方向变化(DC)指标。首先,我们需要了解一些概念:
-
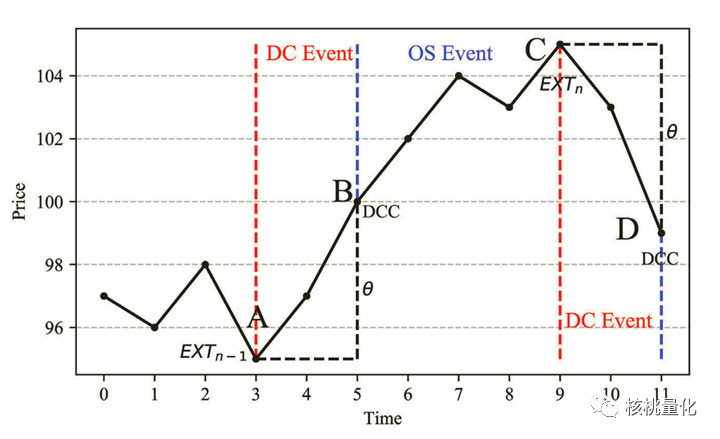
DC事件:方向变化事件,可以是向上或向下的变化。 -
OS事件:超调事件,可以是向上或向下的超调。
指标定义
总价格变动(TMV)指标
这个指标衡量了趋势中的绝对百分比价格变动。具体计算公式如下: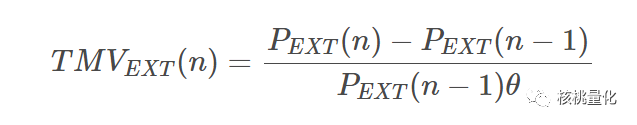
-
TMV_EXT(n):在第n个极点计算得到的总价格变动。 -
P_EXT(n):第n个时期的峰值价格。 -
P_EXT(n-1):第n-1个时期的低谷价格。 -
θ:由研究人员任意定义的阈值。
TMV指标可以衡量资产价格回报的波动性,数值越高表示资产价格回报的波动性越大。
趋势完成所需时间指标
这个指标衡量了完成一个TMV趋势所需的总时间。具体计算公式如下: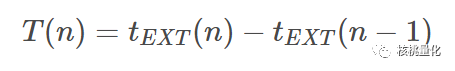
其中:
-
T(n):趋势完成所需的时间。 -
t_EXT(n):峰值发生的时间点。 -
t_EXT(n-1):低谷发生的时间点。
例如,在上图中,完成一个趋势所需的时间为6,因为低谷位于时间点3,峰值位于时间点9。同样的计算方法也适用于向下的转折。
方向变化的时间调整回报(R)指标
这个指标允许我们了解向上或向下趋势中的绝对回报率。它是TMV指标每个时间单位提供的百分比价格回报的衡量。具体计算公式如下: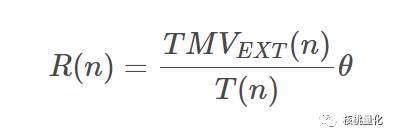
其中,
-
R(n):方向变化的时间调整回报。 -
TMV_EXT(n):TMV指标在极点n处的总价格变动。 -
T(n):趋势完成所需的时间指标。 -
θ:交易者任意选择的阈值。
这三个指标可以作为任何资产波动性的衡量。其中任何一个指标数值较高,都表示资产处于高波动期。
三. 使用Python计算DC指标
DC指标计算需要遍历每一天的数据并检查价格变动,确定上涨和下跌事件,并计算相应的指标。它创建了必要的列并设置初始值,然后根据收盘价和阈值更新最低价和最高价,最后计算并填充DC指标。选择阈值是根据研究人员的选择,通常为0.4%。
# For data manipulation
import numpy as np
import pandas as pd
import yfinance as yf
import pyfolio as pf
from hmmlearn import hmm
from sklearn.utils import check_random_state

# For data visualization
import matplotlib.pyplot as plt

# For ignoring warnings
import warnings
warnings.filterwarnings('ignore')

# Function to create the DC indicators provided by Chen and Tsang (2021)
def directional_change_events(data, theta=0.2):

    # Copy the dataframe
    data = data.copy()

    # Create the necessary columns
    data["Event"] = 0.0
    data["pt"] = 0.0 # current price
    data["ph"] = 0.0 # highest price
    data["pl"] = 0.0 # lowest price
    data["ph_index"] = 0 # highest price index
    data["pl_index"] = 0 # lowest price index

    # Set the initial event variable value
    event = "upward" # initial event

    # Set the initial value for some columns
    data['Close'][0]
    data["pt"].iloc[0] = data['Close'].iloc[0] # current price
    data["ph"].iloc[0] = data['Close'].iloc[0] # highest price
    data["pl"].iloc[0] = data['Close'].iloc[0] # lowest price

    # Create loop to run through each date
    for t in range(0, len(data.index)):
        # Check if we're on a downward trend
        if event == "downward":
            # Check if the close price is less than the low price
            if data["Close"].iloc[t] < data["pl"].iloc[(t-1)]:
                # Set the low price as the close price
                data['pl'].iloc[t] = data["Close"].iloc[t]
                # Set the low price index as the current index
                data["pl_index"].iloc[t] = t
            # Check if the close price is higher than the low price by the theta threshold
            if data["Close"].iloc[t] >= data["pl"].iloc[(t-1)] * (1 + theta):
                # Set a low price variable as the previous low price index
                pl_index = data["pl_index"].iloc[(t-1)]
                # Trigger an upward trend event
                data['Event'].iloc[pl_index] = 1
                # Set the event variable to upward
                event = "upward"
                # Set the high price as the close price
                data["ph"].iloc[t] = data["Close"].iloc[t]
                # Set the high price index as the current index
                data["ph_index"].iloc[t] = t
        # Check if we're on a upward trend
        elif event == "upward":
            # Check if the close price is higher than the high price
            if data["Close"].iloc[t] > data["ph"].iloc[(t-1)]:
                # Set the high price as the close price
                data["ph"].iloc[t] = data["Close"].iloc[t]
                # Set the high price index as the current index
                data["ph_index"].iloc[t] = t
            # Check if the close price is less than the high price by the theta threshold
            if data["Close"].iloc[t] <= data["ph"].iloc[(t-1)] * (1 - theta):
                # Set a high price variable as the previous high price index
                ph_index = data["ph_index"].iloc[(t-1)]
                # Trigger a downward trend event
                data['Event'].iloc[ph_index] = -1 # start downturn event
                # Set the event variable to downward
                event = "downward"
                # Set the low price as the close price
                data["pl"].iloc[t] = data["Close"].iloc[t]
                # Set the low price index as the current index
                data["pl_index"].iloc[t] = t

    # Forward-fill the low and high price indexes
    data['ph_index'] = data['ph_index'].replace(to_replace=0, method='ffill')
    data['pl_index'] = data['pl_index'].replace(to_replace=0, method='ffill')

    # Forward-fill the low and high prices
    data['ph'] = data['ph'].replace(to_replace=0, method='ffill')
    data['pl'] = data['pl'].replace(to_replace=0, method='ffill')

    #data['Event'] = data['Event'].replace(to_replace=0, method='ffill')

    # Compute the TMV indicator and forward-fill it
    data['TMV'] = np.where(data['Event']==-1, abs(data['ph']-data['pl'])/(data['pl']*theta),0)
    data['TMV'] = np.where(data['Event']==1, abs(data['pl']-data['ph'])/(data['ph']*theta),data['TMV'])
    data['TMV'] = data['TMV'].replace(to_replace=0, method='ffill')

    # Compute the time-completion-for-a-trend indicator and forward-fill it
    data['T'] = np.where((data['Event']==-1) | (data['Event']==1), abs(data['ph_index']-data['pl_index']),0)
    data['T'] = data['T'].replace(to_replace=0, method='ffill')

    # Compute the time-adjusted-return indicator and forward-fill it
    data['R'] = np.where((data['Event']==-1) | (data['Event']==1), np.log(data['TMV']/data['T']*theta),0)
    #data['R'] = np.log(data['TMV']/data['T']*theta)
    data['R'] = data['R'].replace(to_replace=0, method='ffill')

    return data
发布者:股市刺客,转载请注明出处:https://www.95sca.cn/archives/111040
站内所有文章皆来自网络转载或读者投稿,请勿用于商业用途。如有侵权、不妥之处,请联系站长并出示版权证明以便删除。敬请谅解!


