
这是创建Trading View策略最快的方法。我创建的模板包括止损和获利功能,绘图、日期范围以及策略的买入和卖出条件。我相信这将使Trading View社区的人们比仅仅重复Pine脚本代码更快、更有效地创建策略。使用此脚本的人只需要添加自己的指标,并创建自己的买入和卖出信号即可。然后他们可以立即开始回测他们的新策略!
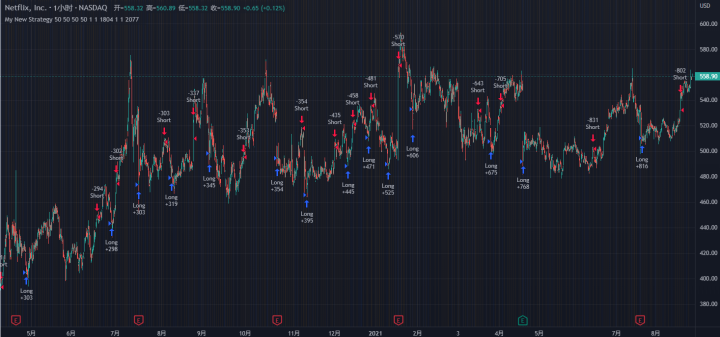

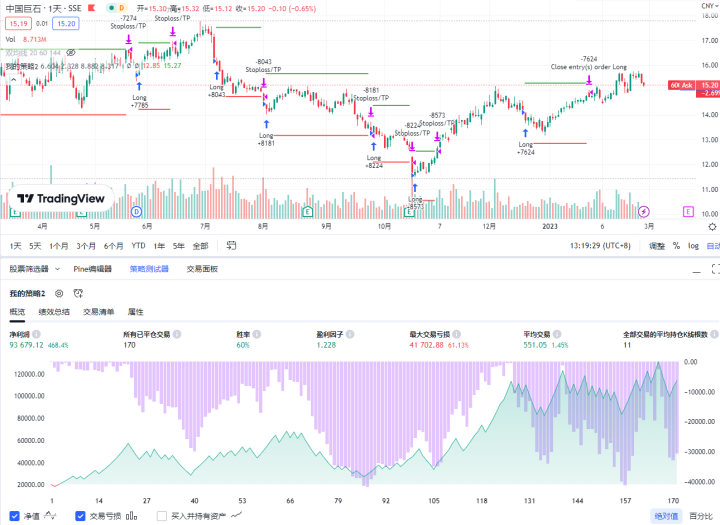
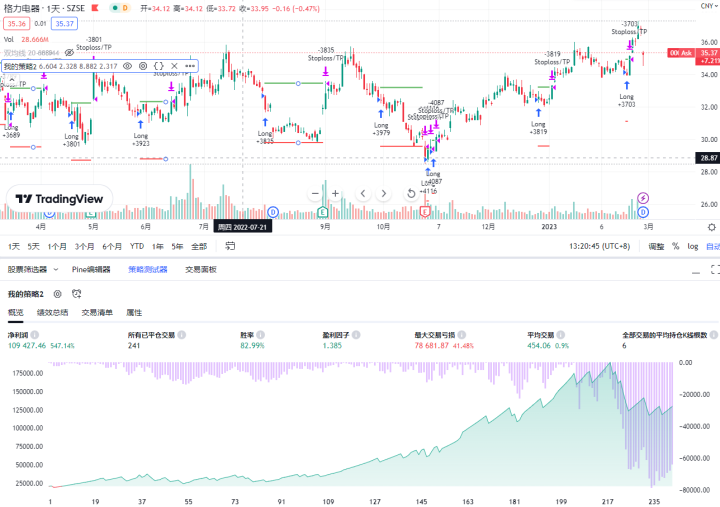
实际应用中,通过编写自己的策略实现可回测利润率
以下是编写TradingView策略的一般步骤:
- 首先,打开TradingView平台并选择您想要交易的市场和图表。
- 在图表底部选择”Pine Editor”,这将打开Pine编程环境。
- 在Pine Editor中,您可以开始编写您的策略。您可以从头开始编写代码,或使用现有的策略模板。
- 在编写代码时,您需要确定要使用的指标和交易条件。您可以使用内置的指标,或编写自己的指标。在确定了指标后,您需要编写交易条件,以便您的策略在满足特定条件时执行交易。
- 编写代码后,您可以使用”Pine翻译器”将其编译为可在TradingView平台上运行的代码。
- 在”Pine翻译器”中,您可以测试您的策略并进行回测。回测是测试策略在历史市场数据上的表现,以确定其有效性。
- 如果您的策略经过回测后表现良好,您可以在实时市场中使用它来执行交易。在执行交易之前,您需要确定您的风险管理策略,并确保您的策略已经经过充分的测试和验证。
需要注意的是,编写TradingView策略需要一定的编程经验和市场知识。如果您不熟悉编程或市场交易,建议寻求专业人士的帮助。
//@version=5
// This source code is subject to the terms of the Mozilla Public License 2.0 at https://mozilla.org/MPL/2.0/
// © Bunghole 2021

strategy(title='My New Strategy', initial_capital=100000, default_qty_type=strategy.percent_of_equity, default_qty_value=100, pyramiding=0, currency='USD', overlay=true)

//// Stoploss and Take Profit Parameters
// Enable Long Strategy
enable_long_strategy = input.bool(true, title='Enable Long Strategy', group='SL/TP For Long Strategy', inline='1')
long_stoploss_value = input.float(defval=50, title='Stoploss %', minval=0.1, group='SL/TP For Long Strategy', inline='2')
long_stoploss_percentage = close * (long_stoploss_value / 100) / syminfo.mintick
long_takeprofit_value = input.float(defval=50, title='Take Profit %', minval=0.1, group='SL/TP For Long Strategy', inline='2')
long_takeprofit_percentage = close * (long_takeprofit_value / 100) / syminfo.mintick

// Enable Short Strategy
enable_short_strategy = input.bool(true, title='Enable Short Strategy', group='SL/TP For Short Strategy', inline='3')
short_stoploss_value = input.float(defval=50, title='Stoploss %', minval=0.1, group='SL/TP For Short Strategy', inline='4')
short_stoploss_percentage = close * (short_stoploss_value / 100) / syminfo.mintick
short_takeprofit_value = input.float(defval=50, title='Take Profit %', minval=0.1, group='SL/TP For Short Strategy', inline='4')
short_takeprofit_percentage = close * (short_takeprofit_value / 100) / syminfo.mintick

// Plot Stoploss & Take Profit Levels
long_stoploss_price = strategy.position_avg_price * (1 - long_stoploss_value / 100)
long_takeprofit_price = strategy.position_avg_price * (1 + long_takeprofit_value / 100)
short_stoploss_price = strategy.position_avg_price * (1 + short_stoploss_value / 100)
short_takeprofit_price = strategy.position_avg_price * (1 - short_takeprofit_value / 100)
plot(enable_long_strategy and not enable_short_strategy ? long_stoploss_price : na, color=color.new(#ff0000, 0), style=plot.style_linebr, linewidth=2, title='Long SL Level')
plot(enable_long_strategy and not enable_short_strategy ? long_takeprofit_price : na, color=color.new(#008000, 0), style=plot.style_linebr, linewidth=2, title='Long TP Level')
plot(enable_short_strategy and not enable_long_strategy ? short_stoploss_price : na, color=color.new(#ff0000, 0), style=plot.style_linebr, linewidth=2, title='Short SL Level')
plot(enable_short_strategy and not enable_long_strategy ? short_takeprofit_price : na, color=color.new(#008000, 0), style=plot.style_linebr, linewidth=2, title='Short TP Level')

// Date Range
start_date = input.int(title='Start Date', defval=1, minval=1, maxval=31, group='Date Range', inline='1')
end_date = input.int(title='End Date', defval=1, minval=1, maxval=31, group='Date Range', inline='1')
start_month = input.int(title='Start Month', defval=1, minval=1, maxval=12, group='Date Range', inline='2')
end_month = input.int(title='End Month', defval=1, minval=1, maxval=12, group='Date Range', inline='2')
start_year = input.int(title='Start Year', defval=1804, minval=1800, maxval=3000, group='Date Range', inline='3')
end_year = input.int(title='End Year', defval=2077, minval=1800, maxval=3000, group='Date Range', inline='3')
in_date_range = time >= timestamp(syminfo.timezone, start_year, start_month, start_date, 0, 0) and time < timestamp(syminfo.timezone, end_year, end_month, end_date, 0, 0)

//// Inputs   **This is where you enter your indicators for your strategy. For example, I added the RSI indicator.**
//RSI
rsi = ta.rsi(close, 14)
rsi_over_sold = rsi < 30
rsi_over_bought = rsi > 70


//// Strategy  **This is where you create your strategy. For example, We have or buy and sell signals.**
// Creating Long and Short Strategy
buy_signal = rsi_over_sold
sell_signal = rsi_over_bought

// Long Strategy
if buy_signal and in_date_range and enable_long_strategy == true
    strategy.entry('Long', strategy.long, when=buy_signal, alert_message='Open Long Position')
    strategy.exit('Long  SL/TP', from_entry='Long', loss=long_stoploss_percentage, profit=long_takeprofit_percentage, alert_message='Your Long SL/TP Limit As Been Triggered.')
    strategy.close('Long', when=sell_signal, alert_message='Close Long Position')

// Short Strategy
if sell_signal and in_date_range and enable_short_strategy == true
    strategy.entry('Short', strategy.short, when=sell_signal, alert_message='Open Short Position')
    strategy.exit('Short SL/TP', from_entry='Short', loss=short_stoploss_percentage, profit=short_takeprofit_percentage, alert_message='Your Short SL/TP Limit As Been Triggered.')
    strategy.close('Short', when=buy_signal, alert_message='Close Short Position')
发布者:股市刺客,转载请注明出处:https://www.95sca.cn/archives/212375
站内所有文章皆来自网络转载或读者投稿,请勿用于商业用途。如有侵权、不妥之处,请联系站长并出示版权证明以便删除。敬请谅解!