
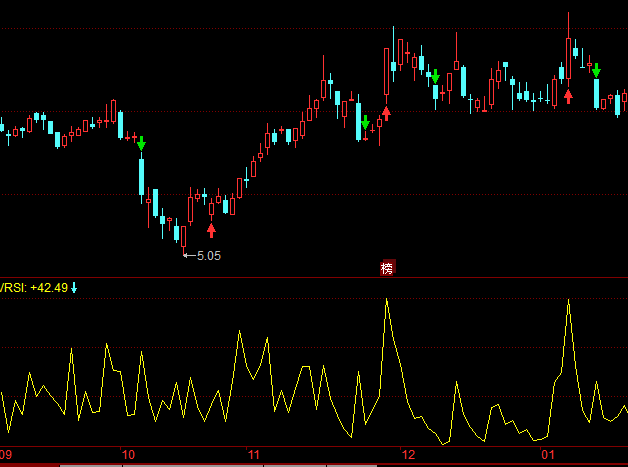
一、VRSI指标简介
VRSI计算方法
-
计算价格变动:
-
价格上涨时:
U = (Close - Low) * Volume -
价格下跌时:
D = (High - Close) * Volume
-
-
计算平均增益(+U)和平均损失(-D):
-
使用移动平均(例如,使用13天移动平均)。
-
-
计算RS:
-
RS = Average Gain / Average Loss
-
-
计算VRSI:
-
VRSI = 100 - (100 / (1 + RS))
-
二、VRSI交易策略
交易信号
-
买入信号:当VRSI从超卖区域上升穿过30,可能表示买方市场活跃,为买入机会。
-
卖出信号:当VRSI从超买区域下降穿过70,可能表示卖方市场活跃,为卖出机会。
策略逻辑
-
选择适当的移动平均周期来计算VRSI。
-
使用VRSI的交叉和阈值作为交易信号。
-
设定止损和止盈规则,以管理风险。
三、VRSI策略量化实战

import pandas as pdimport numpy as npimport matplotlib.pyplot as plt
def calculate_vrsi(df, window=13):    df['U'] = (df['Close'] - df['Low']) * df['Volume']    df['D'] = (df['High'] - df['Close']) * df['Volume']    df['AvgGain'] = df['U'].rolling(window).mean()    df['AvgLoss'] = df['D'].rolling(window).mean().abs()    df['RS'] = df['AvgGain'] / df['AvgLoss']    df['VRSI'] = 100 - (100 / (1 + df['RS']))    return df['VRSI']
# 示例数据df = pd.DataFrame({    'High': [...],  # 填充股票的最高价数据    'Low': [...],   # 填充股票的最低价数据    'Close': [...],  # 填充股票的收盘价数据    'Volume': [...],  # 填充股票的成交量数据})
# 计算VRSI指标df['VRSI'] = calculate_vrsi(df)
# 生成交易信号df['Signal'] = np.where(df['VRSI'] > 70, -1, 0)  # 卖出信号df['Signal'][df['VRSI'] < 30] = 1  # 买入信号
# 绘制VRSI指标和交易信号plt.figure(figsize=(14, 7))plt.plot(df['VRSI'], label='VRSI')plt.plot(df['Signal'], label='Signals', color='red')plt.axhline(y=70, color='grey', linestyle='--')plt.axhline(y=30, color='grey', linestyle='--')plt.title('VRSI Indicator with Trading Signals')plt.legend()plt.show()四、结论
发布者:股市刺客,转载请注明出处:https://www.95sca.cn/archives/106031
站内所有文章皆来自网络转载或读者投稿,请勿用于商业用途。如有侵权、不妥之处,请联系站长并出示版权证明以便删除。敬请谅解!