
今天把etf的列表可视化出来,人是视觉动物,可视化非常重要。
看下效果:

01 从tushare下载场内基金基本信息
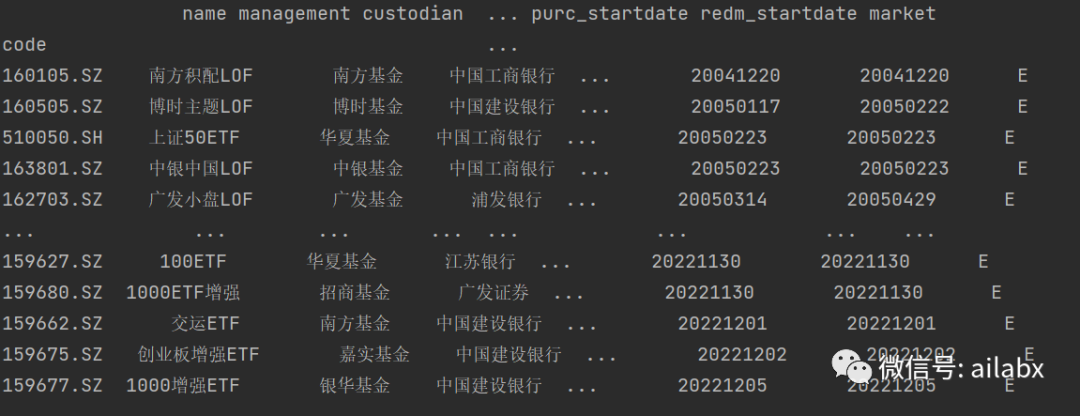
A股场内基金一共1700多支(比场外基金少多了),退市的500多支,可交易的1205支。
# ================ basic =========================
def download_etfs_basic():
    # 拉取数据
    df = pro.fund_basic(**{
        "ts_code": "",
        "market": "E",
        "update_flag": "",
        "offset": "",
        "limit": "",
        "status": "L",
        "name": ""
    }, fields=[
        "ts_code",
        "name",
        "management",
        "custodian",
        "fund_type",
        "found_date",
        "due_date",
        "list_date",
        "issue_date",
        "delist_date",
        "issue_amount",
        "m_fee",
        "c_fee",
        "duration_year",
        "p_value",
        "min_amount",
        "exp_return",
        "benchmark",
        "status",
        "invest_type",
        "type",
        "trustee",
        "purc_startdate",
        "redm_startdate",
        "market"
    ])
    df.rename(columns={'ts_code': 'code'}, inplace=True)
    df.sort_values(by='list_date', inplace=True)
    df.set_index('code', inplace=True)
    return df
调用的代码,写入hdf5:
from engine.config import DATA_DIR_HDF5_ALL, DATA_DIR_HDF5_BASIC
basic = download_etfs_basic()
print(basic)

with pd.HDFStore(DATA_DIR_HDF5_BASIC.resolve()) as store:
    store['etfs'] = download_etfs_basic()
结果显示:(最早的etf,上市时间是2004年底)
02 streamlit读出并查询etfs
@staticmethod
def load_etfs_basic():
    with pd.HDFStore(DATA_DIR_HDF5_BASIC.resolve()) as store:
        return store['etfs']
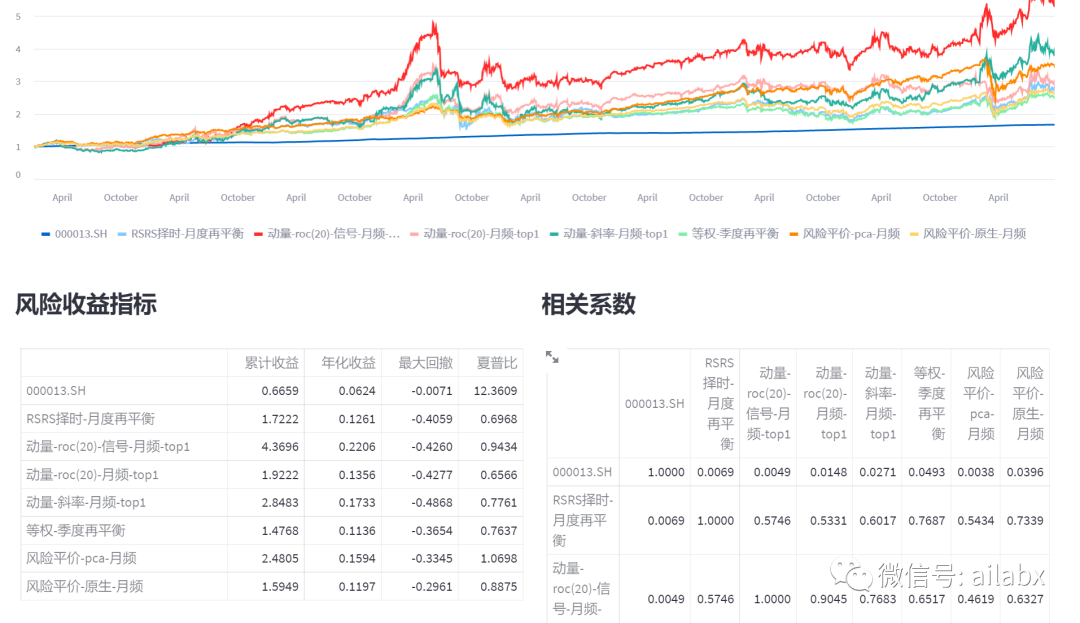
03 界面布局
col_indicators, col_corr = st.columns(2)
col_indicators.subheader('风险收益指标')
col_indicators.table(DataUtils.calc_indicators(df_returns))

col_corr.subheader('相关系数')
col_corr.table(df_returns.corr())
核心代码就是st.columns(N),即可以横向布局:
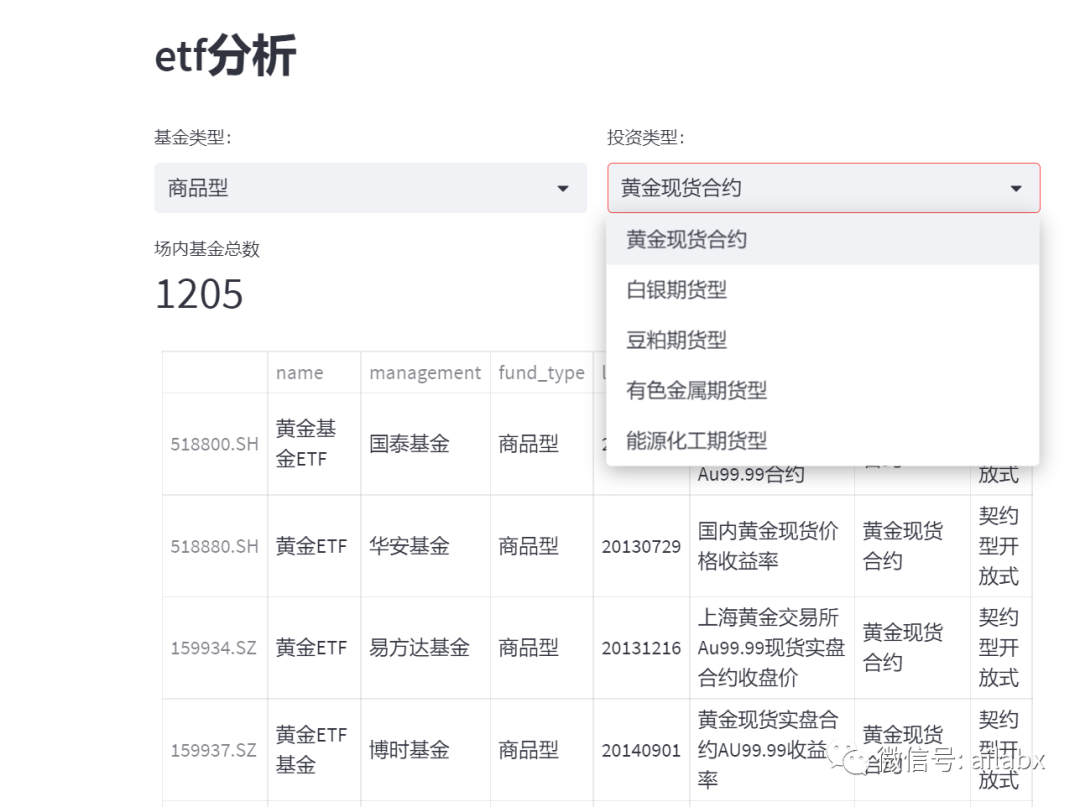
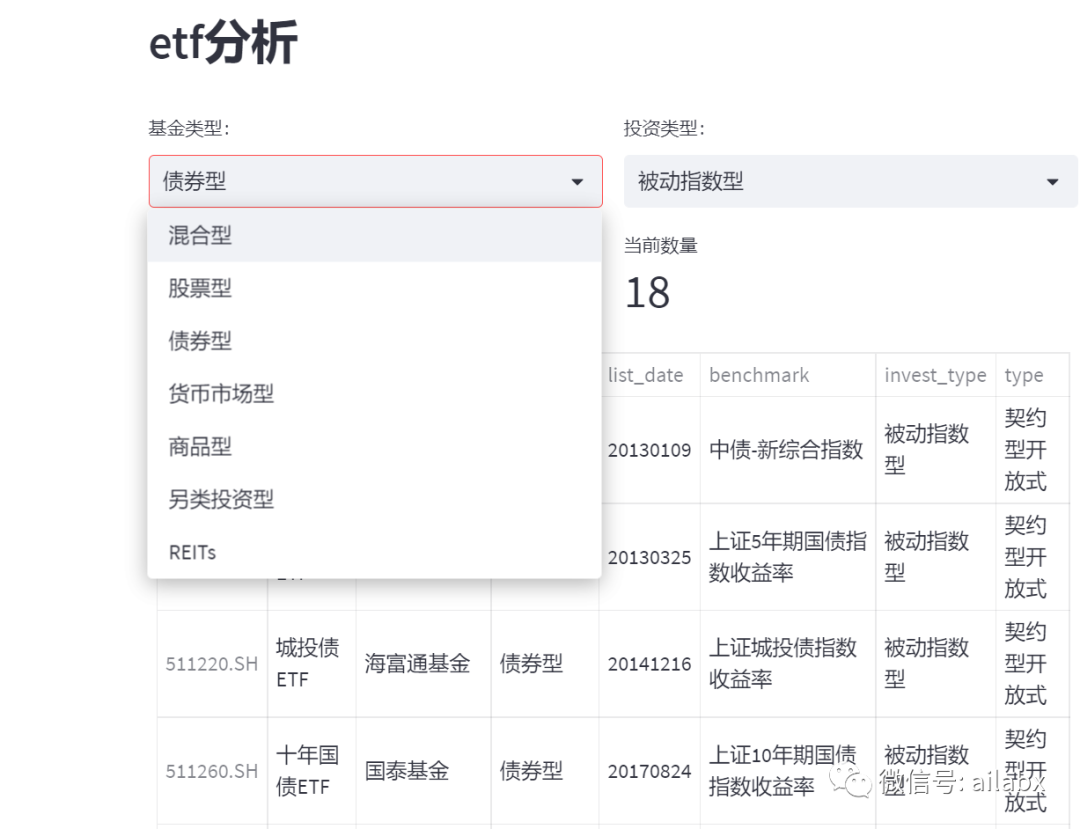
04 etf筛选
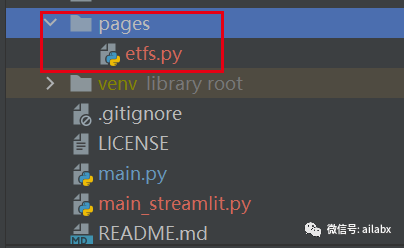
这里使用了streamlit的多页面:
只需要在main.py的同级目录下,创建一个pages,然后里面的xx.py都会自动生成一个页面:
多级联动也非常简单,主要使用pandas的query查询语法:
import streamlit as st
from engine.data_utils import DataUtils
from engine.logic import Logic

st.header('etf分析')


@st.cache
def load_etfs():
    return Logic.load_etfs_basic()


col_fund, col2_invest = st.columns(2)
# 基金类型
df = load_etfs()
total = len(df)
fund_type = col_fund.selectbox('基金类型:', options=df['fund_type'].unique())

df = df.query("fund_type == '{}'".format(fund_type))
invest_type = col2_invest.selectbox('投资类型:', options=df['invest_type'].unique())
df = df.query("invest_type == '{}'".format(invest_type, fund_type))

col1, col2 = st.columns(2)
col1.metric("场内基金总数", total)
col2.metric("当前数量", len(df))
st.table(df)
streamlit特别适合数据驱动型,机器学习型的项目,尤其是用于演示类的需求。后续可以把etf的一些指标计算比如,比如20日动量等,即可以支持指标选基金。
发布者:股市刺客,转载请注明出处:https://www.95sca.cn/archives/104193
站内所有文章皆来自网络转载或读者投稿,请勿用于商业用途。如有侵权、不妥之处,请联系站长并出示版权证明以便删除。敬请谅解!