
用python绘制2D/3D动画图形来实现数据可视化,可以更直观地观察数据随着时间的变化而变化。matplotlib工具包默认的动画看起来很单调,并不适合数据比较。本文相关的基础知识可阅读以下文章:
本文以九个ETF基金行情数据为例,绘制出交易这九个基金的收益变化(行情数据有随机数生成)。如果想观察哪只基金的收益高于或低于沪深300ETF,就可以从2D/3D的动画图上看出来。下面分四部分来讲述。
import numpy as np
import pandas as pd

#import csv
#from csv import writer

# 绘图
import matplotlib.pyplot as plt
from matplotlib import animation, rc
from matplotlib.cm import get_cmap
from mpl_toolkits.mplot3d import Axes3D
from matplotlib.font_manager import FontProperties
from matplotlib.collections import LineCollection
from matplotlib.colors import ListedColormap
from mpl_toolkits.mplot3d.art3d import Line3DCollection

plt.rcParams['font.sans-serif'] = ['SimHei']
plt.rcParams['axes.unicode_minus'] = False

import matplotlib as mpl
mpl.rcParams['animation.ffmpeg_path'] = r'C:\\ffmpeg\\bin\\ffmpeg.exe'

# 设置动画类型
rc('animation', html='html5')
导入数据
用随机数生成九只ETF基金的行情价格数据
index_returns = np.random.normal(loc=1e-4, scale=5e-3, size=(783, 9))
index_returns = np.vstack((np.zeros(shape=(1, 9)) + 100, index_returns))

# 累计收益
index_prices = np.cumprod(1 + index_returns, axis=0)

# 选择时间窗口
window = 261
indexes_rolling = np.zeros(shape=(index_prices.shape[0]-window, 9))

# 生成滚动收益
for i in range(window, index_prices.shape[0], 1):
    indexes_rolling[i-window] = (index_prices[i]/index_prices[i-window]) - 1

# 构成 dataframe 数据
index = pd.date_range('2019-01-01', periods=index_prices.shape[0]-window, freq='B')
columns = ['智能汽车|515250', '新能源车|515030 ', '半 导 体|512480',
                  ' 银  行 |512800', ' 沪深300|510300',  '创 新 药|159992',
                  ' 光  伏 |515790', '信息技术|159939', '食品饮料|515170']
indexes_rolling = pd.DataFrame(indexes_rolling, index=index, columns=columns)
2D动画
- 创建2D动画的规格以及格式,即指定该动画图形的大小,颜色,图例等内容。
代码如下:
# 创建图形
fig, axes = plt.subplots(1, 2, figsize=(18, 6), gridspec_kw={'width_ratios': [.9, .1]})
fig.patch.set_alpha(1)
# 设置:右边的图形不可见,只更新左边部分
axes[1].axis('off')
ax = axes[0]
# 获取 cmap
cmap = get_cmap('RdYlGn')
# 数据切分
current_slice = indexes_rolling.values[:261, :]
index_names = indexes_rolling.columns
index_dates = indexes_rolling.index
# 保存各ETF基金数据的列表
lines = []
for i in range(current_slice.shape[1]):
# 获取坐标
x = np.array(np.arange(current_slice.shape[0]))
y = np.array(current_slice[:, i])
# 绘制不同颜色的点和线段
points = np.array([x, y]).T.reshape(-1, 1, 2)
segments = np.concatenate([points[:-1], points[1:]], axis=1)
# 指定连续值,映射数据点的颜色
norm = plt.Normalize(-0.19, 0.19)
lc = LineCollection(segments, cmap=cmap, norm=norm)
# 设置颜色值
lc.set_array(y)
lc.set_linewidth(2)
lc.set_color(cmap(y[-1] * 2.5 + 0.5))
lc.set_label(index_names[i])
lines.append(ax.add_collection(lc))
# 添加背景的网格
ax.legend(loc='center right', bbox_to_anchor=(1.2, 0.5), fancybox=True, facecolor=(.95,.95,.95,1), framealpha=1, shadow=False, frameon=True, ncol=1, columnspacing=0, prop={'family': 'SimHei'})
ax.yaxis.grid(color='gray', linestyle='dashed')
ax.xaxis.grid(color='gray', linestyle='dashed')
ax.set_xlim(0, current_slice.shape[0]-1)
ax.set_ylim(-0.39, 0.39)
ax.set_yticklabels(['{:.0%}'.format(val) for val in ax.get_yticks()])
ax.set_ylabel('滚动收益 - 1年')
ax.set_xlabel('日 期')
ax.set_xticklabels([index_dates[int(val)].strftime('%m/%y') for val in ax.get_xticks()])
#ax.set_facecolor((0, 0, 0, 1.0)) # 背景色
ax.set_facecolor((0.05, 0.05, 0.65, 1))
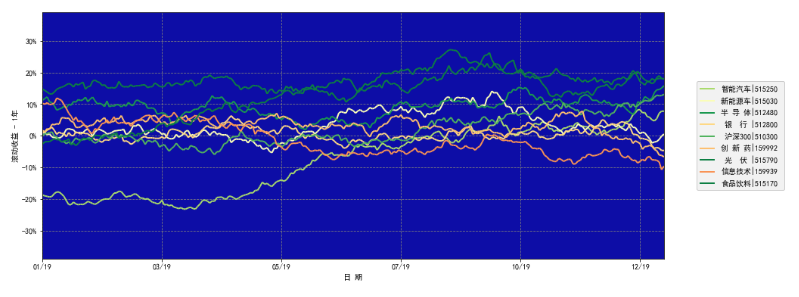
# 演示图形
plt.show()演示图形如下:

2. 定义更新以上2D图形的函数
代码如下:
def update_lines_2D(num, data, columns, dates, cmap, lines, ax):

    # 获得切分数据
    current_slice = data[num:261+num, :]
    current_dates = dates[num:261+num]

    for i in range(current_slice.shape[1]):

        # 获取坐标值
        x = np.array(np.arange(current_slice.shape[0]))
        y = np.array(current_slice[:, i])

        # 绘制不同颜色的点和线段
        points = np.array([x, y]).T.reshape(-1, 1, 2)
        segments = np.concatenate([points[:-1], points[1:]], axis=1)

        # 指定连续值,映射数据点的颜色
        norm = plt.Normalize(-0.22, 0.22)
        lines[i].set_segments(segments)
        lines[i].set_array(y)
        #lines[i].set_color(cmap(y[-1] * 2.5 + 0.5))
        lines[i].set_color(cmap(y[-1] * 2.5 + 0.5))

    # 动态更新数据和标识
    ax.set_xticklabels([dates[int(val)+num].strftime('%m/%y') for val in ax.get_xticks()[:-1]] + [''])
    ax.legend(loc='center right', bbox_to_anchor=(1.2, 0.5), fancybox=True, facecolor=(.95,.95,.95,1), framealpha=1, shadow=False, frameon=True, ncol=1, columnspacing=0, prop={'family': 'SimHei'})

    return lines

# 初始化图形的各行的数据
def init_lines_2D():

    for line in lines:
        line.set_array([])
    return lines
3.创建2D动画
代码如下:
line_ani = animation.FuncAnimation(fig=fig,
                                   func=update_lines_2D,
                                   # frames=30,
                                   frames=indexes_rolling.shape[0]-261,
                                   init_func=init_lines_2D,
                                   fargs=(indexes_rolling.values, indexes_rolling.columns, indexes_rolling.index, cmap, lines, ax),
                                   interval=75,
                                   blit=True)

# 演示2D动画
line_ani
演示结果如下图:
4.保存动画为GIF格式
代码如下:
# 演示数据的变化
progress_callback = lambda i, n: print('Saving frame {:.0%}'.format(i/n)) if int((i/n) * 100) % 10 == 0 else None

# 保存动画
line_ani.save('./2D_animation.gif', writer='imagemagick', fps=14, dpi=80, codec='h264', bitrate=2048, progress_callback=progress_callback)
3D动画
- 创建3D动画的规格以及格式,即指定该动画图形的大小,颜色,图例等内容。
代码如下:
# 创建图形
fig = plt.figure(figsize=(14.4, 9))
ax = fig.add_subplot(111, projection='3d')
fig.patch.set_alpha(1)
# 获得 cmap 的值
cmap = get_cmap('RdYlGn')
# 切分数据
current_slice = indexes_rolling.values[:261, :]
index_names = indexes_rolling.columns
index_dates = indexes_rolling.index
# 保存各ETF基金数据的线的列表
lines = []
for i in range(current_slice.shape[1]):
# 获取坐标值
x = np.array(np.arange(current_slice.shape[0]))
y = np.tile(i, current_slice.shape[0])
z = np.array(current_slice[:, i])
# 绘制不同颜色的点和线段
points = np.array([x, y, z]).T.reshape(-1, 1, 3)
segments = np.concatenate([points[:-1], points[1:]], axis=1)
# 指定连续值,映射数据点的颜色
norm = plt.Normalize(-0.19, 0.19)
lc = Line3DCollection(segments, cmap=cmap, norm=norm, zorder=current_slice.shape[1]-i)
# 动态更新数据和标识
lc.set_array(z)
lc.set_linewidth(2)
lc.set_color(cmap(z[-1] * 2.5 + 0.5))
lc.set_label(index_names[i])
lines.append(ax.add_collection(lc))
# 添加动画背景的网格
ax.legend(loc='center right', bbox_to_anchor=(1.1, 0.46), fancybox=True, facecolor=(.95,.95,.95,1), framealpha=1, shadow=False, frameon=True, ncol=1, columnspacing=0, prop={'family': 'SimHei'})
ax.set_zlabel('滚动收益 1Y', labelpad=10)
ax.set_zlim(-0.39, 0.39)
ax.set_zticklabels([' '* 3 + '{:.0%}'.format(val) for val in ax.get_zticks()], fontdict={'verticalalignment': 'center', 'horizontalalignment': 'center'})
ax.set_xlabel('Date', labelpad=30)
ax.set_xlim(0, current_slice.shape[0]-1)
ax.set_xticklabels([index_dates[int(val)].strftime('%m/%y') for val in ax.get_xticks()[:-1]] + [''], rotation=0, fontdict={'verticalalignment': 'top', 'horizontalalignment': 'center'})
ax.set_yticks(np.arange(current_slice.shape[1]))
ax.set_yticklabels([index_names[i] for i in range(current_slice.shape[1])], rotation=-15, fontdict={'verticalalignment': 'center', 'horizontalalignment': 'left'})
# ax.w_xaxis.set_pane_color((0, 0, 0, 1.0))
# ax.w_yaxis.set_pane_color((0, 0, 0, 1.0))
# ax.w_zaxis.set_pane_color((0, 0, 0, 1.0))
ax.w_xaxis.set_pane_color((0.05, 0.05, 0.65, 1)) #ax.set_facecolor((0.05, 0.05, 0.65, 1))
ax.w_yaxis.set_pane_color((0.05, 0.05, 0.65, 1))
ax.w_zaxis.set_pane_color((0.05, 0.05, 0.65, 1))
ax.view_init(25, -60)
# ------------------------------------------------------------------
x_scale=1.8
y_scale=1
z_scale=1
scale=np.diag([x_scale, y_scale, z_scale, 1.0])
scale=scale*(1.0/scale.max())
scale[3,3]=1.0
def short_proj():
return np.dot(Axes3D.get_proj(ax), scale)
ax.get_proj=short_proj
fig.subplots_adjust(left=0, right=1, bottom=0, top=1)
# ------------------------------------------------------------------
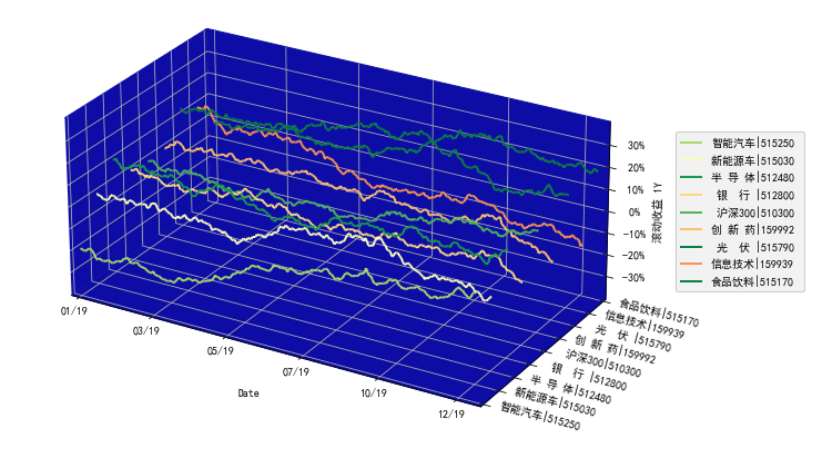
# 输出动画
plt.show()输出结果如下图所示:
2. 定义更新以上图形的函数
代码如下:
def update_lines_3D(num, data, columns, dates, cmap, lines, ax):
    # 切分数据
    current_slice = data[num:261+num, :]
    current_dates = dates[num:261+num]

     for i in range(current_slice.shape[1]):

        # 获取坐标值
        x = np.arange(current_slice.shape[0])
        y = np.tile(i, current_slice.shape[0])
        z = np.array(current_slice[:, i])

        #  绘制不同颜色的点和线段
        points = np.array([x, y, z]).T.reshape(-1, 1, 3)
        segments = np.concatenate([points[:-1], points[1:]], axis=1)

        # 指定连续值,映射数据点的颜色
        norm = plt.Normalize(-0.19, 0.19)
        lines[i].set_segments(segments)
        lines[i].set_array(z)
        lines[i].set_color(cmap(z[-1] * 2.5 + 0.5))

    # 动态更新数据和标识
    ax.set_xticklabels([dates[int(val)+num].strftime('%m/%y') for val in ax.get_xticks()[:-1]] + [''], rotation=0, fontdict={'verticalalignment': 'top', 'horizontalalignment': 'center'})
    ax.legend(loc='center right', bbox_to_anchor=(1.1, 0.46), fancybox=True, facecolor=(.95,.95,.95,1), framealpha=1, shadow=False, frameon=True, ncol=1, columnspacing=0, prop={'family': 'SimHei'})

    return lines

def init_lines_3D():
    for line in lines:
        line.set_array([])
    return lines
3.创建3D动画
代码如下:
line_ani = animation.FuncAnimation(fig=fig,
                                   func=update_lines_3D,
                                   # frames=30,
                                   frames=indexes_rolling.shape[0]-261,
                                   init_func=init_lines_3D,
                                   fargs=(indexes_rolling.values, indexes_rolling.columns, indexes_rolling.index, cmap, lines, ax),
                                   interval=75,
                                   blit=True)

# 演示3D动画
line_ani
演示结果如下图所示:
4.保存3D动画为GIF格式
progress_callback = lambda i, n: print('Saving frame {:.0%}'.format(i/n)) if int((i/n) * 100) % 10 == 0 else None
# save the animation
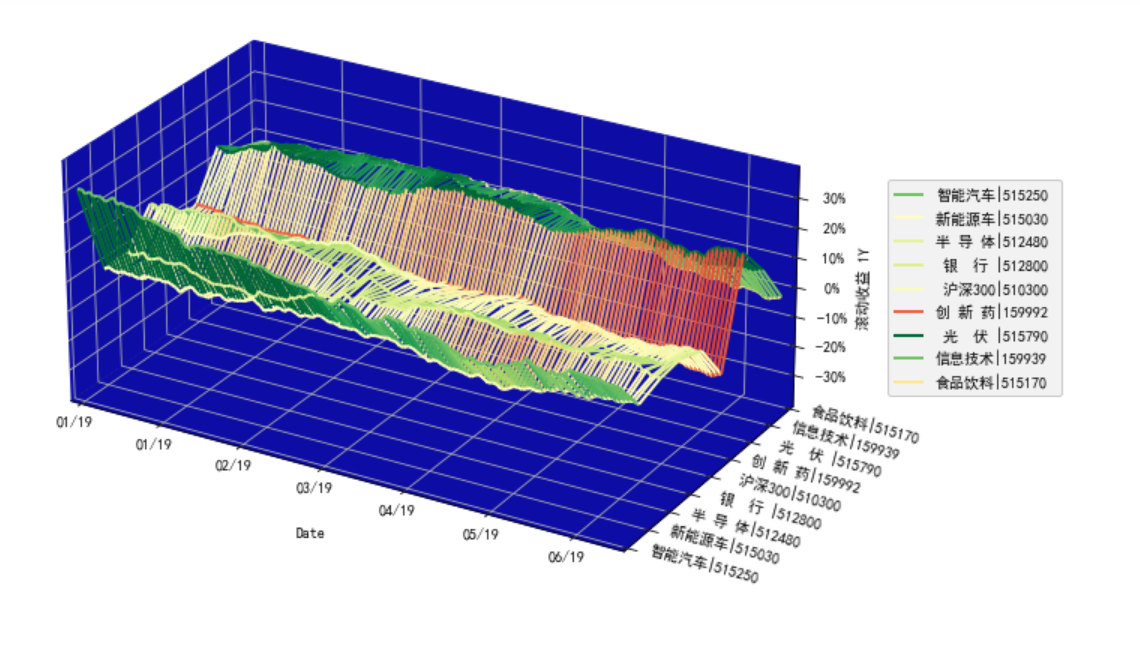
line_ani.save('./3D_animation.gif', writer='imagemagick', fps=14, dpi=80, codec='h264', bitrate=2048, progress_callback=progress_callback)3D mesh 动画
- 创建3D mesh 动画的规格以及格式,即指定该动画图形的大小,颜色,图例等内容。
代码如下:
# 创建图形
fig = plt.figure(figsize=(14.4, 9))
ax = fig.add_subplot(111, projection='3d')
fig.patch.set_alpha(1)

# 获取 cmap 的值
cmap = get_cmap('RdYlGn')

# 切分数据
# current_slice = indexes_rolling.values[:261, :]
current_slice = indexes_rolling.values[:int(261/2), :]
index_names = indexes_rolling.columns
index_dates = indexes_rolling.index

# 保存各ETF基金数据的线的列表
lines = []

for i in range(current_slice.shape[1]):

    # 获取坐标值
    x = np.array(np.arange(current_slice.shape[0]))
    y = np.tile(i, current_slice.shape[0])
    z = np.array(current_slice[:, i])

    # 绘制不同颜色的点和线段
    points = np.array([x, y, z]).T.reshape(-1, 1, 3)
    segments = np.concatenate([points[:-1], points[1:]], axis=1)

    # 指定连续值,映射数据点的颜色
    norm = plt.Normalize(-0.19, 0.19)
    lc = Line3DCollection(segments, cmap=cmap, norm=norm, zorder=current_slice.shape[1]-i)

    # 设定颜色值
    lc.set_array(z)
    lc.set_linewidth(2)
    lc.set_color(cmap(z[-1] * 2.5 + 0.5))
    lc.set_label(index_names[i])
    lines.append(ax.add_collection(lc))

# 保存 mesh 线的列表
mesh_lines = []

for j in range(current_slice.shape[0]):

    if j % 1 == 0:

        # 获取坐标值
        x = np.tile(j, current_slice.shape[1])
        y = np.arange(current_slice.shape[1])
        z = np.array(current_slice[j, :])

        # 绘制不同颜色的点和线段
        points = np.array([x, y, z]).T.reshape(-1, 1, 3)
        segments = np.concatenate([points[:-1], points[1:]], axis=1)

        # 指定连续值,映射数据点的颜色
        norm = plt.Normalize(-0.19, 0.19)
        lc = Line3DCollection(segments, cmap=cmap, norm=norm)

        # 设定颜色值
        lc.set_array(z)
        lc.set_linewidth(2)
        mesh_lines.append(ax.add_collection(lc))

# 添加 mesh 动画的背景网格
ax.legend(loc='center right', bbox_to_anchor=(1.1, 0.46), fancybox=True, facecolor=(.95,.95,.95,1), framealpha=1, shadow=False, frameon=True, ncol=1, columnspacing=0, prop={'family': 'SimHei'})
ax.set_zlabel('Rolling Equity 1Y', labelpad=10)
ax.set_zlim(-0.39, 0.39)
ax.set_zticklabels([' '* 3 + '{:.0%}'.format(val) for val in ax.get_zticks()], fontdict={'verticalalignment': 'center', 'horizontalalignment': 'center'})
ax.set_xlabel('Date', labelpad=30)
ax.set_xlim(0, current_slice.shape[0]-1)
ax.set_xticklabels([index_dates[int(val)].strftime('%m/%y') for val in ax.get_xticks()[:-1]] + [''], rotation=0, fontdict={'verticalalignment': 'top', 'horizontalalignment': 'center'})
ax.set_yticks(np.arange(current_slice.shape[1]))
ax.set_yticklabels([index_names[i]for i in range(current_slice.shape[1])], rotation=-15, fontdict={'verticalalignment': 'center', 'horizontalalignment': 'left'})
ax.w_xaxis.set_pane_color((0.05, 0.05, 0.65, 1))
ax.w_yaxis.set_pane_color((0.05, 0.05, 0.65, 1))
ax.w_zaxis.set_pane_color((0.05, 0.05, 0.65, 1)) # (0.05, 0.05, 0.65, 1)
ax.view_init(25, -60)

# ------------------------------------------------------------------
x_scale=1.8
y_scale=1
z_scale=1

scale=np.diag([x_scale, y_scale, z_scale, 1.0])
scale=scale*(1.0/scale.max())
scale[3,3]=1.0

def short_proj():
    return np.dot(Axes3D.get_proj(ax), scale)

ax.get_proj=short_proj

fig.subplots_adjust(left=0, right=1, bottom=0, top=1)
# ------------------------------------------------------------------

# 输出图形
plt.show()
输出结果如下图所示:
2.定义更新以上图形的函数
代码如下:
def update_mesh_lines_3D(num, data, columns, dates, cmap, lines, mesh_lines, ax):

    # 切分数据
    current_slice = data[num:int(261/2)+num, :]

     for i in range(current_slice.shape[1]):

        # 获取坐标值
        x = np.arange(current_slice.shape[0])
        y = np.tile(i, current_slice.shape[0])
        z = np.array(current_slice[:, i])

        # 绘制不同颜色的点和线段
        points = np.array([x, y, z]).T.reshape(-1, 1, 3)
        segments = np.concatenate([points[:-1], points[1:]], axis=1)

        # 指定连续值,映射数据点的颜色
        norm = plt.Normalize(-0.19, 0.19)
        lines[i].set_segments(segments)
        lines[i].set_array(z)
        lines[i].set_color(cmap(z[-1] * 2.5 + 0.5))

    # 通过计数检查当前的mesh线
    counter = 0

       for j in range(current_slice.shape[0]):

        if j % 1 == 0:

            # 获取坐标值
            x = np.tile(j, current_slice.shape[1])
            y = np.arange(current_slice.shape[1])
            z = np.array(current_slice[j, :])

            # 绘制不同颜色的点和线段
            points = np.array([x, y, z]).T.reshape(-1, 1, 3)
            segments = np.concatenate([points[:-1], points[1:]], axis=1)

            # 设定 mesh 线的颜色值
            norm = plt.Normalize(-0.22, 0.22)
            mesh_lines[counter].set_segments(segments)
            mesh_lines[counter].set_array(z)
            counter += 1

    # 动态更新数据和标识
    ax.set_xticklabels([dates[int(val)+num].strftime('%m/%y') for val in ax.get_xticks()[:-1]] + [''], rotation=0, fontdict={'verticalalignment': 'top', 'horizontalalignment': 'center'})
    ax.legend(loc='center right', bbox_to_anchor=(1.1, 0.46), fancybox=True, facecolor=(.95,.95,.95,1), framealpha=1, shadow=False, frameon=True, ncol=1, columnspacing=0, prop={'family': 'SimHei'})

    return lines

def init_mesh_lines_3D():
    for line in lines:
        line.set_array([])
    return lines
3.创建3D mesh 动画
代码如下:
line_ani = animation.FuncAnimation(fig=fig,
                                   func=update_mesh_lines_3D,
                                   # frames=30,
                                   frames=indexes_rolling.shape[0]-int(261/2),
                                   init_func=init_mesh_lines_3D,
                                   fargs=(indexes_rolling.values, indexes_rolling.columns, indexes_rolling.index, cmap, lines, mesh_lines, ax),
                                   interval=100,
                                   blit=True)

# 演示动画
line_ani
演示结果如下图所示:
发布者:股市刺客,转载请注明出处:https://www.95sca.cn/archives/76331
站内所有文章皆来自网络转载或读者投稿,请勿用于商业用途。如有侵权、不妥之处,请联系站长并出示版权证明以便删除。敬请谅解!