
一、引言
二、配对交易策略概述
三、策略构建步骤
-
交易对象选取:选择两个具有协整关系的资产。
-
数据收集:获取资产的历史价格数据。
-
协整检验:检验两个资产价格序列是否协整。
-
投资组合构建:基于协整关系构建投资组合。
-
设置阈值:确定开仓和止损的阈值。
-
历史回测:使用历史数据测试策略的有效性。
四、Python实现过程
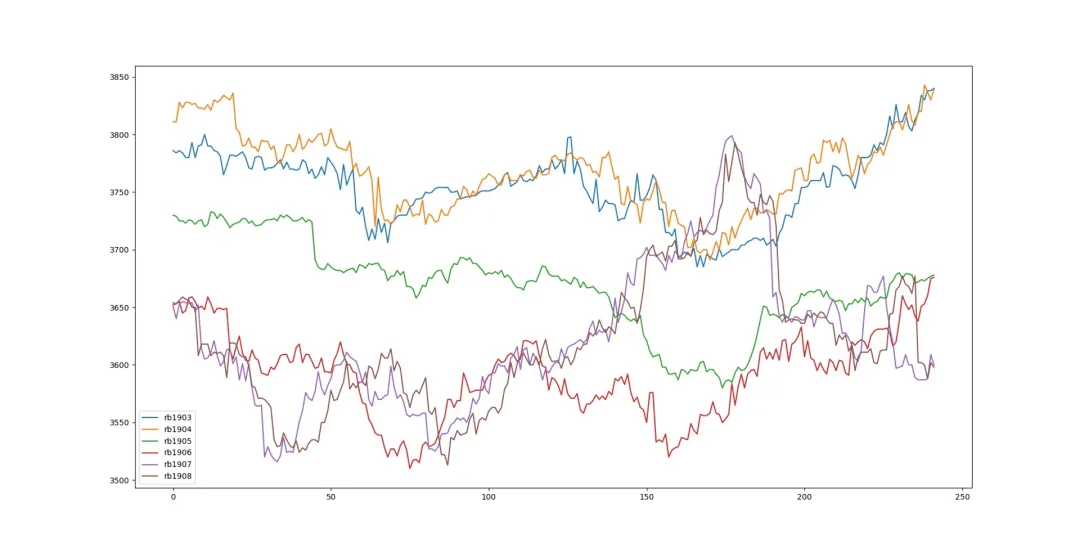

1. 数据收集
def fetch_data(ids): url_5m = 'http://stock2.finance.sina.com.cn/futures/api/json.php/IndexService.getInnerFuturesMiniKLine5m?symbol=' result = [] for id in ids: url = url_5m + id req = urllib2.Request(url) rsp = urllib2.urlopen(req) res = rsp.read() res_json = json.loads(res) result.append(res_json) close_result = [] for instrument in result: oneDay_list = [] for oneDay in instrument: oneDay_list.append(float(oneDay[-2])) close_result.append(np.array(oneDay_list)) close_result = np.array(close_result) close_result = close_result.T df = pd.DataFrame(data=close_result, columns=ids) return df2. 协整检验
from statsmodels.tsa.stattools import adfuller, coint
def check_stationarity(price):    result = adfuller(price)    print(result)
def check_coint(price_A, price_B):    result = coint(price_A, price_B)    print(result)
3. 投资组合构建与阈值设置
def strategy(df, sigma):    price_A = df['rb1907'].values    price_B = df['rb1908'].values    spread = price_A - price_B    mspread = spread - np.mean(spread)    open_threshold = 2 * sigma    stop_threshold = 3 * sigma
    # Plotting the spread and thresholds    fig = plt.figure()    ax = fig.add_subplot(111)    ax.plot(range(len(mspread)), mspread)    ax.hlines(0, 0, len(mspread))    ax.hlines(open_threshold, 0, len(mspread), colors='b')    ax.hlines(-stop_threshold, 0, len(mspread), colors='b')    ax.hlines(stop_threshold, 0, len(mspread), colors='r')    ax.hlines(-stop_threshold, 0, len(mspread), colors='r')    plt.show()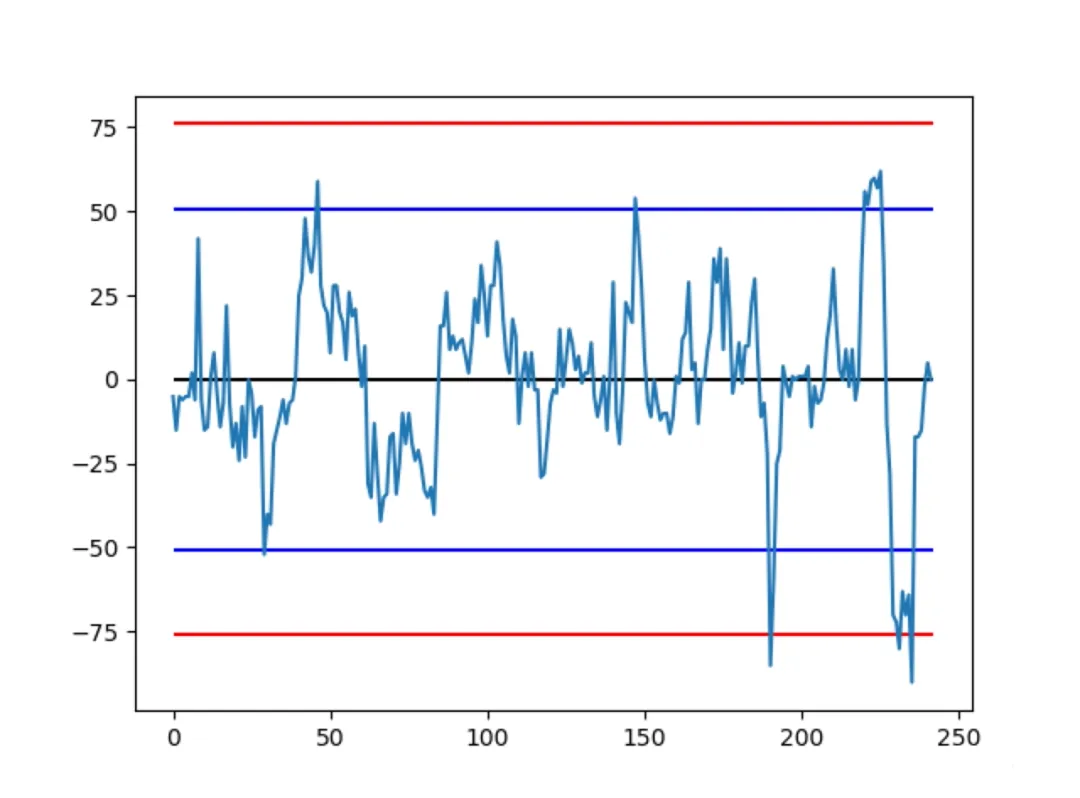
4. 历史回测
def strategy(): df = pd.read_csv('./data.csv') price_A = df['rb1907'].values price_B = df['rb1908'].values spread = price_A - price_B mspread = spread - np.mean(spread) sigma = np.std(mspread) open = 2 * sigma stop = 3 * sigma profit_list = [] hold = False hold_price_A = 0 hold_price_B = 0 hold_state = 0 # 1 (A:long B:short) -1 (A:short B:long) profit_sum = 0 for i in range(len(price_A)): if hold == False: if mspread[i] >= open: hold_price_A = price_A[i] hold_price_B = price_B[i] hold_state = -1 hold = True elif mspread[i] <= -open: hold_price_A = price_A[i] hold_price_B = price_B[i] hold_state = 1 hold = True else: if mspread[i] >= stop and hold_state == -1: profit = (hold_price_A - price_A[i]) + (price_B[i] - hold_price_B) profit_sum += profit hold_state = 0 hold = False elif mspread[i] <= -stop and hold_state == 1: profit = (price_A[i] - hold_price_A) + (hold_price_B - price_B[i]) profit_sum += profit hold_state = 0 hold = False if mspread[i] <= 0 and hold_state == -1: profit = (hold_price_A - price_A[i]) + (price_B[i] - hold_price_B) profit_sum += profit hold_state = 0 hold = False if mspread[i] >= 0 and hold_state == 1: profit = (price_A[i] - hold_price_A) + (hold_price_B - price_B[i]) profit_sum += profit hold_state = 0 hold = False profit_list.append(profit_sum) print(profit_list) fig = plt.figure() ax = fig.add_subplot(111) profit_list) plt.show()结论
发布者:股市刺客,转载请注明出处:https://www.95sca.cn/archives/106042
站内所有文章皆来自网络转载或读者投稿,请勿用于商业用途。如有侵权、不妥之处,请联系站长并出示版权证明以便删除。敬请谅解!