
开始之前,来句鸡汤提提神。
you got a dream,you gotta protect it,if you want something,go get it.如果你有梦想,就要守护它,如果你想要什么,就去实现它。
人的一生,没有标准答案,不违背公序良俗的前提下,按自己喜欢的方式过一生就是成功。
在模型方面,我们从随机森林开始,因为它很简单,然后过渡到lightGBM,xgboost,之前就是深度模型,主要基于pytorch(fastai),以及部分keras。
以决策树为基本学习单元的集成学习,对于表格型数据的处理,在kaggle这样的比赛中大放异彩。决策树的逻辑,与多因子很像。其余的模型,把因子都当成向量中的一个维度,决策树就是一个“因子”。比如择偶,身高>173吗?体重<150斤吗?年收入大于XX等等。在多因子选股中也类似,净利润增长是否为下,RSRS是否大于0.8?
随机森林说是把一堆决策树“打包(bagging)”在一起,共同决策。每次都是“随机”,“有放回”抽样,然后得到一个结果。
pip install scikit-learn即可。它依赖scipy,numpy。
传统机器学习sklearn基本够了。
深度学习我们以pytorch为主,我直接安装fastai,它依赖pytorch, pandas, spacy,依赖的包比较多。
另外keras会一并安装,一些量化的模型是使用keras来实现了。
pip install keras,keras本身支持tensorflow,cntk以及theano作为backend,所以并未强制安装tensorflow。
集成学习的特点:
- 它可以处理数千个输入变量而无需变量删除。
- 它给出了对分类中哪些变量重要的估计。
这两点非常重要,因子好与坏往上堆就是了,模型会自动筛选出来好的。
模型从使用上非常简单:
from sklearn.ensemble import RandomForestRegressor
reg = RandomForestRegressor(random_state=20)
reg.fit(X,y)
这里我需要准备数据,X,y,X就是多因子特征,y是label数据标注,一般我们选择“未来N天的”收益率。
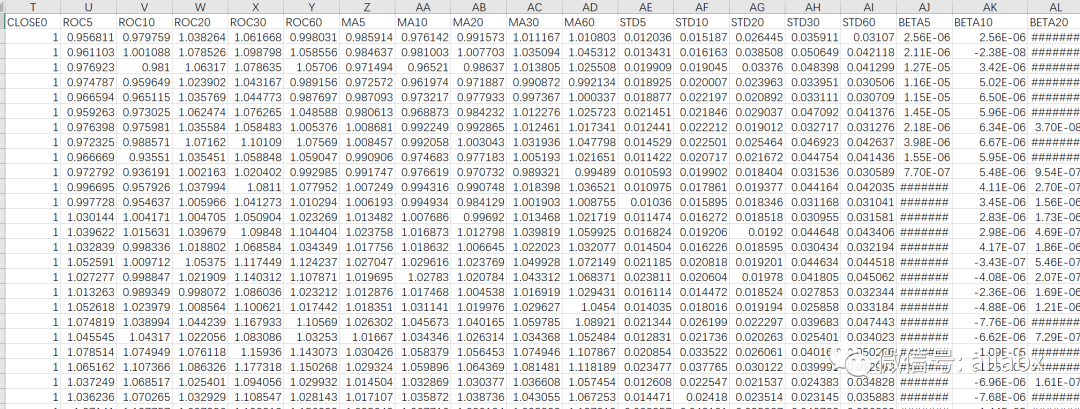
这里借用下qlib的alpha158的因子库,对全球指数进行158个因子的计算。
import pandas as pd


class Alpha158_Dataset:
    def get_label_config(self):
        return ["Ref($close, -20)/Ref($close, -1) - 1"], ["LABEL0"]

    def get_feature_config(self):
        conf = {
            "kbar": {},
            "price": {
                "windows": [0],
                "feature": ["OPEN", "HIGH", "LOW", "CLOSE"],
            },
            "rolling": {},
        }
        return self.parse_config_to_fields(conf)

    @staticmethod
    def parse_config_to_fields(config):
        """create factors from config

        config = {
            'kbar': {}, # whether to use some hard-code kbar features
            'price': { # whether to use raw price features
                'windows': [0, 1, 2, 3, 4], # use price at n days ago
                'feature': ['OPEN', 'HIGH', 'LOW'] # which price field to use
            },
            'volume': { # whether to use raw volume features
                'windows': [0, 1, 2, 3, 4], # use volume at n days ago
            },
            'rolling': { # whether to use rolling operator based features
                'windows': [5, 10, 20, 30, 60], # rolling windows size
                'include': ['ROC', 'MA', 'STD'], # rolling operator to use
                #if include is None we will use default operators
                'exclude': ['RANK'], # rolling operator not to use
            }
        }
        """
        fields = []
        names = []
        if "kbar" in config:
            fields += [
                "($close-$open)/$open",
                "($high-$low)/$open",
                "($close-$open)/($high-$low+1e-12)",
                "($high-Greater($open, $close))/$open",
                "($high-Greater($open, $close))/($high-$low+1e-12)",
                "(Less($open, $close)-$low)/$open",
                "(Less($open, $close)-$low)/($high-$low+1e-12)",
                "(2*$close-$high-$low)/$open",
                "(2*$close-$high-$low)/($high-$low+1e-12)",
            ]
            names += [
                "KMID",
                "KLEN",
                "KMID2",
                "KUP",
                "KUP2",
                "KLOW",
                "KLOW2",
                "KSFT",
                "KSFT2",
            ]
        if "price" in config:
            windows = config["price"].get("windows", range(5))
            feature = config["price"].get("feature", ["OPEN", "HIGH", "LOW", "CLOSE", "VWAP"])
            for field in feature:
                field = field.lower()
                fields += ["Ref($%s, %d)/$close" % (field, d) if d != 0 else "$%s/$close" % field for d in windows]
                names += [field.upper() + str(d) for d in windows]
        if "volume" in config:
            windows = config["volume"].get("windows", range(5))
            fields += ["Ref($volume, %d)/($volume+1e-12)" % d if d != 0 else "$volume/($volume+1e-12)" for d in windows]
            names += ["VOLUME" + str(d) for d in windows]
        if "rolling" in config:
            windows = config["rolling"].get("windows", [5, 10, 20, 30, 60])
            include = config["rolling"].get("include", None)
            exclude = config["rolling"].get("exclude", [])
            # `exclude` in dataset config unnecessary filed
            # `include` in dataset config necessary field

            def use(x):
                return x not in exclude and (include is None or x in include)

            # Some factor ref: https://guorn.com/static/upload/file/3/134065454575605.pdf
            if use("ROC"):
                # https://www.investopedia.com/terms/r/rateofchange.asp
                # Rate of change, the price change in the past d days, divided by latest close price to remove unit
                fields += ["Ref($close, %d)/$close" % d for d in windows]
                names += ["ROC%d" % d for d in windows]
            if use("MA"):
                # https://www.investopedia.com/ask/answers/071414/whats-difference-between-moving-average-and-weighted-moving-average.asp
                # Simple Moving Average, the simple moving average in the past d days, divided by latest close price to remove unit
                fields += ["Mean($close, %d)/$close" % d for d in windows]
                names += ["MA%d" % d for d in windows]
            if use("STD"):
                # The standard diviation of close price for the past d days, divided by latest close price to remove unit
                fields += ["Std($close, %d)/$close" % d for d in windows]
                names += ["STD%d" % d for d in windows]
            if use("BETA"):
                # The rate of close price change in the past d days, divided by latest close price to remove unit
                # For example, price increase 10 dollar per day in the past d days, then Slope will be 10.
                fields += ["Slope($close, %d)/$close" % d for d in windows]
                names += ["BETA%d" % d for d in windows]
            if use("RSQR"):
                pass
                # The R-sqaure value of linear regression for the past d days, represent the trend linear
                #fields += ["Rsquare($close, %d)" % d for d in windows]
                #names += ["RSQR%d" % d for d in windows]
            if use("RESI"):
                pass
                # The redisdual for linear regression for the past d days, represent the trend linearity for past d days.
                #fields += ["Resi($close, %d)/$close" % d for d in windows]
                #names += ["RESI%d" % d for d in windows]
            if use("MAX"):
                # The max price for past d days, divided by latest close price to remove unit
                fields += ["Max($high, %d)/$close" % d for d in windows]
                names += ["MAX%d" % d for d in windows]
            if use("LOW"):
                # The low price for past d days, divided by latest close price to remove unit
                fields += ["Min($low, %d)/$close" % d for d in windows]
                names += ["MIN%d" % d for d in windows]
            if use("QTLU"):
                # The 80% quantile of past d day's close price, divided by latest close price to remove unit
                # Used with MIN and MAX
                fields += ["Quantile($close, %d, 0.8)/$close" % d for d in windows]
                names += ["QTLU%d" % d for d in windows]
            if use("QTLD"):
                # The 20% quantile of past d day's close price, divided by latest close price to remove unit
                fields += ["Quantile($close, %d, 0.2)/$close" % d for d in windows]
                names += ["QTLD%d" % d for d in windows]
            if use("RANK"):
                # Get the percentile of current close price in past d day's close price.
                # Represent the current price level comparing to past N days, add additional information to moving average.
                fields += ["Rank($close, %d)" % d for d in windows]
                names += ["RANK%d" % d for d in windows]
            if use("RSV"):
                # Represent the price position between upper and lower resistent price for past d days.
                fields += ["($close-Min($low, %d))/(Max($high, %d)-Min($low, %d)+1e-12)" % (d, d, d) for d in windows]
                names += ["RSV%d" % d for d in windows]
            if use("IMAX"):
                # The number of days between current date and previous highest price date.
                # Part of Aroon Indicator https://www.investopedia.com/terms/a/aroon.asp
                # The indicator measures the time between highs and the time between lows over a time period.
                # The idea is that strong uptrends will regularly see new highs, and strong downtrends will regularly see new lows.
                fields += ["IdxMax($high, %d)/%d" % (d, d) for d in windows]
                names += ["IMAX%d" % d for d in windows]
            if use("IMIN"):
                # The number of days between current date and previous lowest price date.
                # Part of Aroon Indicator https://www.investopedia.com/terms/a/aroon.asp
                # The indicator measures the time between highs and the time between lows over a time period.
                # The idea is that strong uptrends will regularly see new highs, and strong downtrends will regularly see new lows.
                fields += ["IdxMin($low, %d)/%d" % (d, d) for d in windows]
                names += ["IMIN%d" % d for d in windows]
            if use("IMXD"):
                # The time period between previous lowest-price date occur after highest price date.
                # Large value suggest downward momemtum.
                fields += ["(IdxMax($high, %d)-IdxMin($low, %d))/%d" % (d, d, d) for d in windows]
                names += ["IMXD%d" % d for d in windows]
            if use("CORR"):
                # The correlation between absolute close price and log scaled trading volume
                fields += ["Corr($close, Log($volume+1), %d)" % d for d in windows]
                names += ["CORR%d" % d for d in windows]
            if use("CORD"):
                # The correlation between price change ratio and volume change ratio
                fields += ["Corr($close/Ref($close,1), Log($volume/Ref($volume, 1)+1), %d)" % d for d in windows]
                names += ["CORD%d" % d for d in windows]
            if use("CNTP"):
                # The percentage of days in past d days that price go up.
                fields += ["Mean($close>Ref($close, 1), %d)" % d for d in windows]
                names += ["CNTP%d" % d for d in windows]
            if use("CNTN"):
                # The percentage of days in past d days that price go down.
                fields += ["Mean($close<Ref($close, 1), %d)" % d for d in windows]
                names += ["CNTN%d" % d for d in windows]
            if use("CNTD"):
                # The diff between past up day and past down day
                fields += ["Mean($close>Ref($close, 1), %d)-Mean($close<Ref($close, 1), %d)" % (d, d) for d in windows]
                names += ["CNTD%d" % d for d in windows]
            if use("SUMP"):
                # The total gain / the absolute total price changed
                # Similar to RSI indicator. https://www.investopedia.com/terms/r/rsi.asp
                fields += [
                    "Sum(Greater($close-Ref($close, 1), 0), %d)/(Sum(Abs($close-Ref($close, 1)), %d)+1e-12)" % (d, d)
                    for d in windows
                ]
                names += ["SUMP%d" % d for d in windows]
            if use("SUMN"):
                # The total lose / the absolute total price changed
                # Can be derived from SUMP by SUMN = 1 - SUMP
                # Similar to RSI indicator. https://www.investopedia.com/terms/r/rsi.asp
                fields += [
                    "Sum(Greater(Ref($close, 1)-$close, 0), %d)/(Sum(Abs($close-Ref($close, 1)), %d)+1e-12)" % (d, d)
                    for d in windows
                ]
                names += ["SUMN%d" % d for d in windows]
            if use("SUMD"):
                # The diff ratio between total gain and total lose
                # Similar to RSI indicator. https://www.investopedia.com/terms/r/rsi.asp
                fields += [
                    "(Sum(Greater($close-Ref($close, 1), 0), %d)-Sum(Greater(Ref($close, 1)-$close, 0), %d))"
                    "/(Sum(Abs($close-Ref($close, 1)), %d)+1e-12)" % (d, d, d)
                    for d in windows
                ]
                names += ["SUMD%d" % d for d in windows]
            if use("VMA"):
                # Simple Volume Moving average: https://www.barchart.com/education/technical-indicators/volume_moving_average
                fields += ["Mean($volume, %d)/($volume+1e-12)" % d for d in windows]
                names += ["VMA%d" % d for d in windows]
            if use("VSTD"):
                # The standard deviation for volume in past d days.
                fields += ["Std($volume, %d)/($volume+1e-12)" % d for d in windows]
                names += ["VSTD%d" % d for d in windows]
            if use("WVMA"):
                # The volume weighted price change volatility
                fields += [
                    "Std(Abs($close/Ref($close, 1)-1)*$volume, %d)/(Mean(Abs($close/Ref($close, 1)-1)*$volume, %d)+1e-12)"
                    % (d, d)
                    for d in windows
                ]
                names += ["WVMA%d" % d for d in windows]
            if use("VSUMP"):
                # The total volume increase / the absolute total volume changed
                fields += [
                    "Sum(Greater($volume-Ref($volume, 1), 0), %d)/(Sum(Abs($volume-Ref($volume, 1)), %d)+1e-12)"
                    % (d, d)
                    for d in windows
                ]
                names += ["VSUMP%d" % d for d in windows]
            if use("VSUMN"):
                # The total volume increase / the absolute total volume changed
                # Can be derived from VSUMP by VSUMN = 1 - VSUMP
                fields += [
                    "Sum(Greater(Ref($volume, 1)-$volume, 0), %d)/(Sum(Abs($volume-Ref($volume, 1)), %d)+1e-12)"
                    % (d, d)
                    for d in windows
                ]
                names += ["VSUMN%d" % d for d in windows]
            if use("VSUMD"):
                # The diff ratio between total volume increase and total volume decrease
                # RSI indicator for volume
                fields += [
                    "(Sum(Greater($volume-Ref($volume, 1), 0), %d)-Sum(Greater(Ref($volume, 1)-$volume, 0), %d))"
                    "/(Sum(Abs($volume-Ref($volume, 1)), %d)+1e-12)" % (d, d, d)
                    for d in windows
                ]
                names += ["VSUMD%d" % d for d in windows]

        return fields, names

    def get_all_fields_names(self):
        fields, names = self.get_feature_config()
        fields_label, names_label = self.get_label_config()
        fields += fields_label
        names += names_label
        return fields, names,


if __name__ == '__main__':

    fields, names = Alpha158_Dataset().get_all_fields_names()
    from quant_project.dataloader.dataloader import Dataloader
    df = Dataloader().load_datas('__all__', names=names, fields=fields)

    df.to_csv('features.csv')
    with pd.HDFStore('features.h5')as s:
        s['alpha158'] = df
然后保存到csv和hdf5里备用,这里都是价量数据。
csv的因子数据68M,h5格式的33M。

我们的label是预测“未来20天的收益率”,我们是按月度调仓,所以这个20天比较合理。
拟合得分95.1%,下面是各个维度的得分。
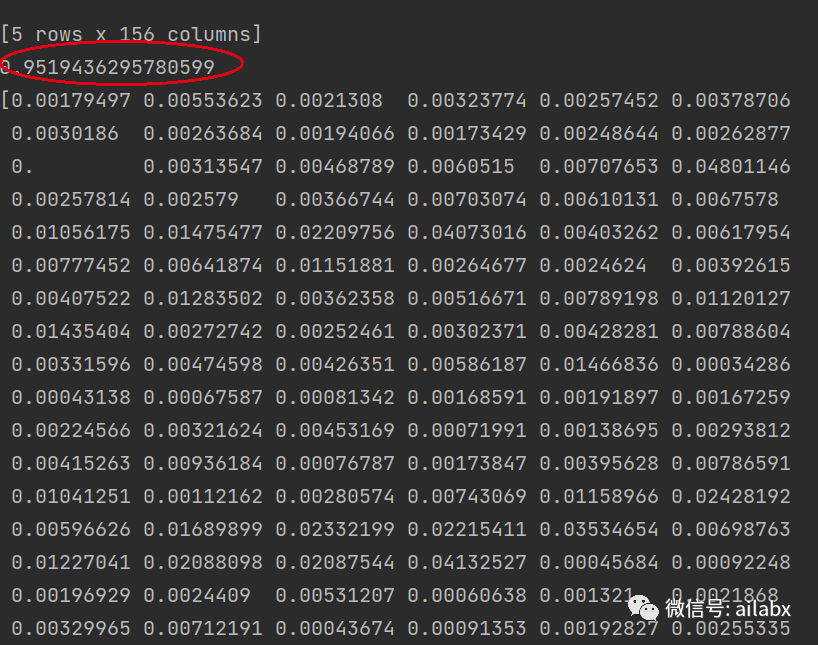
但是测试集上是负分!明显过拟合了。
发布者:股市刺客,转载请注明出处:https://www.95sca.cn/archives/104156
站内所有文章皆来自网络转载或读者投稿,请勿用于商业用途。如有侵权、不妥之处,请联系站长并出示版权证明以便删除。敬请谅解!