MACD 柱形图被视为最好的价格趋势指标之一。。根据 A. Elder 博士的建议,价格趋势由相应时间范围上最后两个柱决定。但是,根据那两个柱我们无法说明任何其他事情。当然,一名经验丰富的交易者通过观看柱形图可以根据他或她的直觉进行一些想象。如果我们取最后三个柱进行分析,则信息的数量和质量将大大提高。
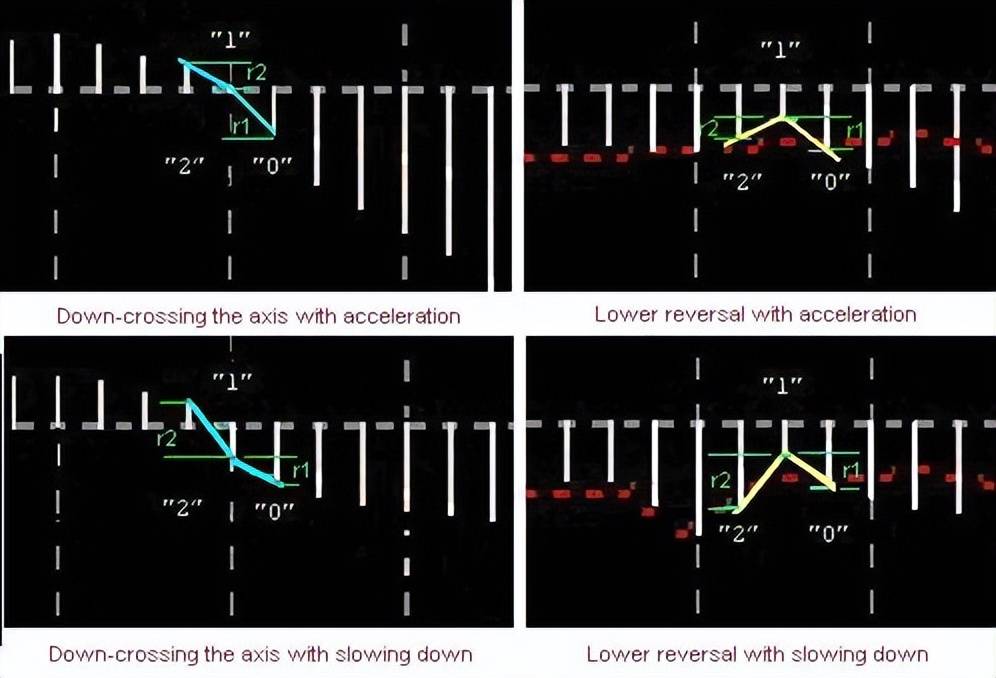
脚本算法基于对比 MACD 柱形图上第零个、第一个和第二个柱增量的差异。。例如,如果当前和上一个柱的差值超过了上一个和上上一个柱的差值,则趋势以正加速度增长。如果差值比它小,说明趋势增长减慢(衰减趋势),应该考虑关闭多头头寸。
对脚本自身的一瞥:
至少可以在两个方向使用脚本。
第一,可以用作交易助手,定义市场进入/退出点,以及根据柱形图成交量的位置、方向和正/负加速度确定交易手数(交易量)。
第二,可以在分析历史数据时使用脚本。如果将脚本添加至图表以分析数据,会显示属性窗口,可以在其中指定(更改)初始柱数量和要分析的时间范围。如果在实时交易中使用脚本,应该将初始柱数量设置为零(最后的当前柱)或一(根据用户的意愿),且应指定用于打开或维持头寸的时间范围。
//+------------------------------------------------------------------+
//|                                                 TrendMACD v5.mq4 |
//|MACD histogram analysis by the last three bars             Genkov |
//|                                                     genkov@bk.ru |
//+------------------------------------------------------------------+
#property copyright "Genkov"
#property link      "genkov@bk.ru"
//if you comment on the below line, the properties window will not be displayed
#property show_inputs
extern int a = 0;            // here you can specify any initial bar to be analyzed
//extern int period = 1;     //  1 minute
//extern int period = 5;     //  5 minutes
//extern int period = 15;    // 15 minutes
extern int period = 30;      //  30 minutes
//extern int period = 60;    // comment on the timeframe you need
//extern int period = 240;   // 4 hours
//extern int period = 1440;  // day
//extern int period = 10080; // week
//extern int period = 43200; // month
//+------------------------------------------------------------------+我们为初始柱数量设置主变量‘a’,为脚本的全局变量的时间范围设置变量‘period‘为脚本的全局变量的时间范围设置变量‘。计算和对比的内部变量将在函数启动后设置:>
int start()
  {
    int b,c;
    b=a+1; c=b+1;
//----
double Macd_h1_a= iMACD(NULL,period,12,26,9,PRICE_CLOSE,MODE_MAIN,a);
double Macd_h1_b= iMACD(NULL,period,12,26,9,PRICE_CLOSE,MODE_MAIN,b);
double Macd_h1_c= iMACD(NULL,period,12,26,9,PRICE_CLOSE,MODE_MAIN,c);
为了计算的可视化控制,可以在这里设置 Print() 运算符,对于分析过去的(历史)事件会很有用。乘数“*1000”(或你可以使用其他乘数)使获得结果具有更好的可读性。
Print("   Macd_h1_c= ",Macd_h1_c*1000,"   Macd_h1_b= ",
          Macd_h1_b*1000,"   Macd_h1_a= ",Macd_h1_a*1000);
如果需要禁用信息(提醒),应在“int Message = 1;”运算符内用零替换一。同时,要显示信息,应在运算符“int Message = 1;”和“Message == 1;”上注释并用Print() 运算符替换所有后续的 Alert() 运算符,然后就可以在客户端的“Expert Advisors”选项卡内看到信息。Print() 运算符替换所有后续的 Alert() 运算符,然后就可以在客户端的“Expert Advisors”选项卡内看到信息。
脚本提供了使用 GetTickCount() 函数计算脚本运行时间的可能性。为此,在程序开头设置以下运算符:
int start=GetTickCount();
//…
//…, and at the end of the program:
Alert("   Calculation time  ", GetTickCount()-start," millisec");
脚本的主代码包含了对比状态(在分析的柱上柱值间差异的位置和比例高低)的程序块。
脚本中,分析了主要相关的可能短暂状态(状况)。例如:

程序中共有 6 个对比程序块:程序块 1-2 用于轴线以下的 MACD;
// ----------------------for MACD below the axis-------------------------1--&
  if(Macd_h1_c0.0&&Macd_h1_a<0.0&&Macd_h1_a<0.0)
   {
     //increment of bar "0" as related to the first one
     double r1=MathAbs(MathAbs(Macd_h1_a)-MathAbs(Macd_h1_b));
     //increment of bar "1" as related to bar "2"
     double r2=MathAbs(MathAbs(Macd_h1_b)-MathAbs(Macd_h1_c));
// -- MACD is below - the trend is moving down
   if(Macd_h1_c>Macd_h1_b&&Macd_h1_b>Macd_h1_a)
    {
     if(r1>r2)
     {
     Alert("On bar ",a," MACD<0 = ",Macd_h1_a,
           "  The trend is moving down \\\'with acceleration");
     }
    if(r1<r2)
     {
     Alert("On bar ",a," MACD<0 = ",Macd_h1_a,
           "  The trend is moving down \^with slowing down");
     }
    if((r1==r2)||MathAbs(r1-r2)<0.000015)
     {
     Alert("On bar ",a," MACD<0 = ",Macd_h1_a,
           "  The trend is moving down with constant acceleration");
     }
    }
// -- MACD is below - the trend is moving up
   if(Macd_h1_c<Macd_h1_b&&Macd_h1_b<Macd_h1_a)
    {
    if(r1>r2)
     {
     Alert("On bar ",a," MACD<0 =",Macd_h1_a,
           "  The trend is moving up //''with acceleration");
     }
    if(r1<r2)
     {
     Alert("On bar",a," MACD<0 = ",Macd_h1_a,
           "  The trend is moving up /^with slowing down");
     }
    if((r1==r2)||MathAbs(r1-r2)<0.000015)
     {
     Alert("On bar ",a," MACD<0 = ",Macd_h1_a,
           "  The trend is moving up with constant acceleration");
     }
    }
// --- MACD is below - the trend reverses down
   if(Macd_h1_c<Macd_h1_b&&Macd_h1_b>Macd_h1_a)
    {
    if(r1>r2)
     {
     Alert("On bar ",a," MACD<0 = ",Macd_h1_a,
           "  The trend reverses down /\\'with acceleration");
     }
    if(r1<r2)
     {
     Alert("On bar",a," MACD<0 = ",Macd_h1_a,
           "  The trend reverses down //^with slowing down");
     }
    }
// --- MACD is below - the trend reverses up
   if(Macd_h1_c>Macd_h1_b&&Macd_h1_b<Macd_h1_a)
    {
    if(r1>r2)
     {
     Alert("On bar ",a," MACD<0 = ",Macd_h1_a,
           "  The trend reverses up //''with acceleration");
     }
     if(r1<r2)
     {
     Alert("On bar ",a," MACD<0 = ",Macd_h1_a,
           "  The trend reverses up \/^with slowing down");
     }
    }
   if(MathAbs(MathAbs(Macd_h1_a)-MathAbs(Macd_h1_b))<0.0002 &&
      MathAbs(MathAbs(Macd_h1_c)-MathAbs(Macd_h1_b))<0.0002)
    {
    Alert("On bar ",a,", it is Flat! within the range of:  ",Macd_h1_c,
          "   ",Macd_h1_b,"   ",Macd_h1_a);
    }
   }
程序块 2-3 非常相似 – 用于轴线以上的 MACD(查看附件)。
程序块 3-4 用于向上交叉轴线:
// ------------for up-crossing the axis------------------3--&
   if(Macd_h1_c<0.0 && Macd_h1_b<0.0 && Macd_h1_a>0&&  // c<0 b<0
      Macd_h1_c<Macd_h1_b&&Macd_h1_b<Macd_h1_a)
    {
     r1=MathAbs(Macd_h1_a)+MathAbs(Macd_h1_b);
     r2=MathAbs(Macd_h1_c)-MathAbs(Macd_h1_b);
    if(MathAbs(r1)>MathAbs(r2))
     {
     Alert("On bar ",a," the trend is up-crossing axis //'' with acceleration ");
     }
    if(MathAbs(r1)<MathAbs(r2))
     {
     Alert("On bar",a," the trend is up-crossing axis /^ with slowing down ");
     }
    }
//---
   if(Macd_h1_c<0.0 && Macd_h1_b>0.0 && Macd_h1_a>0&&  // b>0 a>0
      Macd_h1_c<Macd_h1_b&&Macd_h1_b<Macd_h1_a)
    {
     r1=MathAbs(Macd_h1_a)-MathAbs(Macd_h1_b);
     r2=MathAbs(Macd_h1_c)+MathAbs(Macd_h1_b);
    if(MathAbs(r1)>MathAbs(r2))
     {
     Alert("On bar ",a," the trend is up-crossing axis //''with acceleration");
     }
    if(MathAbs(r1)<MathAbs(r2))
     {
     Alert("On bar ",a," the trend is up-crossing axis /^ with slowing down");
     }
    }
相应的,程序块 4-5 用于向下交叉轴线(查看附件)。
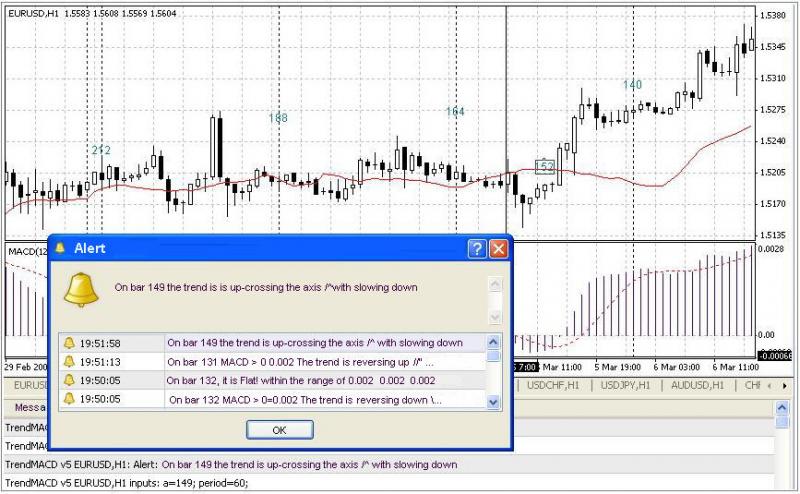
程序块 5-6 用于轴线下反转,程序块 6-7 用于轴线上反转。程序块经过注释,那些喜欢分析历史数据的人可以使用(查看附件)。
下面是脚本分析历史数据的示例:

如果你要使用脚本交易,其标头应该如下:
//+------------------------------------------------------------------+
//|                                                 TrendMACD v6.mq4 |
//|     for trading                                                  |
//+------------------------------------------------------------------+

#property copyright "Genkov"
#property link      "genkov@bk.ru"
extern int a = 0;      // here you can specify the initial bar to be analyzed
extern int period = 30;       // set the value of the period you need
//+------------------------------------------------------------------+
int start()
  {
   int b,c; b=a+1; c=b+1;
//----
  double Macd_h1_a= iMACD(NULL,period,12,26,9,PRICE_CLOSE,MODE_MAIN,a);
  double Macd_h1_b= iMACD(NULL,period,12,26,9,PRICE_CLOSE,MODE_MAIN,b);
  double Macd_h1_c= iMACD(NULL,period,12,26,9,PRICE_CLOSE,MODE_MAIN,c);
…
….
其他对比程序块跟给出的基本版本相同。
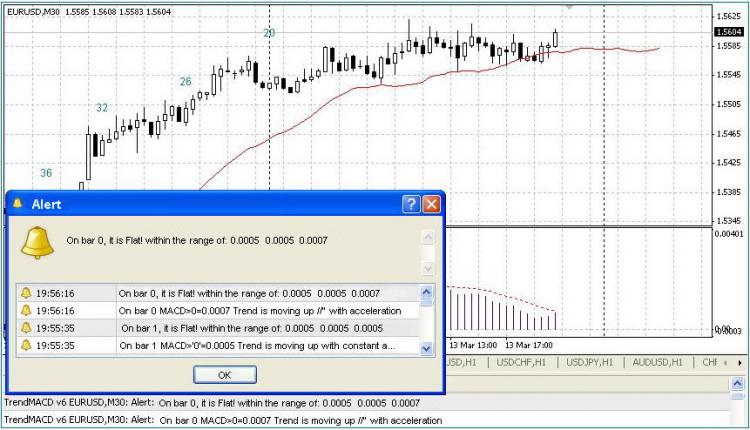
下面是如何使用脚本交易的示例:

请注意:变量‘a’和‘period’的值必须在开始使用脚本前设置!此外,在交易版本中最好将初始柱设置为一,因为零柱在请求数据时,例如在周期开始或中间,可能变得不完整。
最后,我想表达自己的希望,期待使用该脚本能帮助交易新手和富有经验的交易者,以及将错误量降低至少 10%。祝愿大家交易开心!
发布者:股市刺客,转载请注明出处:https://www.95sca.cn/archives/575586
站内所有文章皆来自网络转载或读者投稿,请勿用于商业用途。如有侵权、不妥之处,请联系站长并出示版权证明以便删除。敬请谅解!


