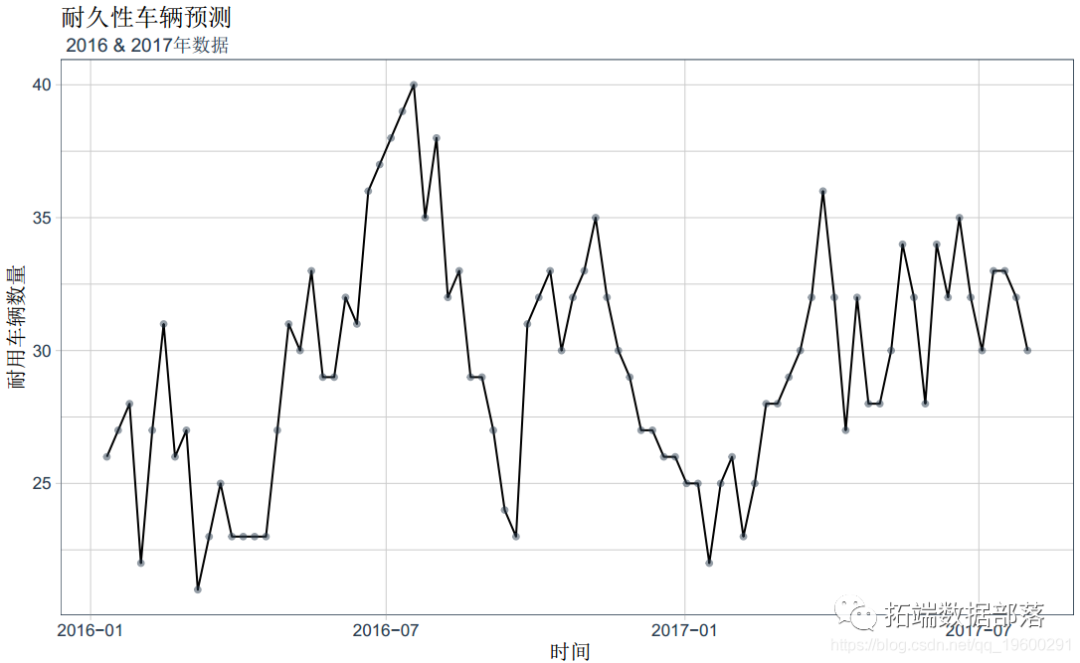
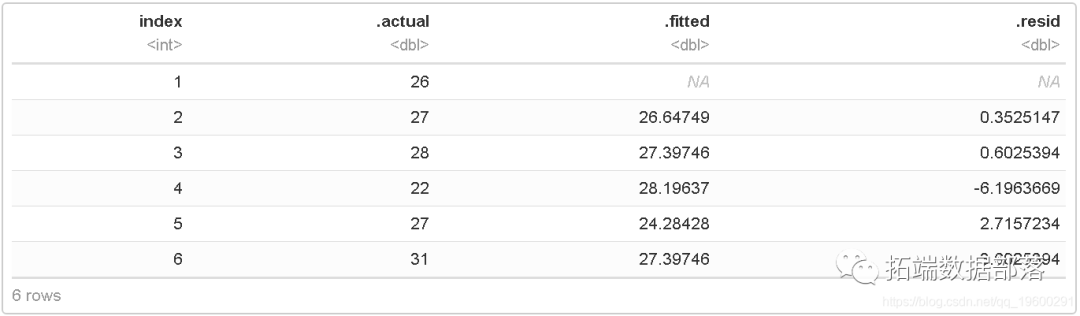
## # A tibble: 6 x 2## Date Actual## <dttm> <dbl>## 1 2016-01-11 26## 2 2016-01-18 27## 3 2016-01-25 28## 4 2016-02-01 22## 5 2016-02-08 27## 6 2016-02-15 31dat%>%ggplot(aes(Date,Actual))+labs(title = "耐久性车辆预测", x = "时间", y = "耐用车辆数量",subtitle = " 2016 & 2017年数据") +
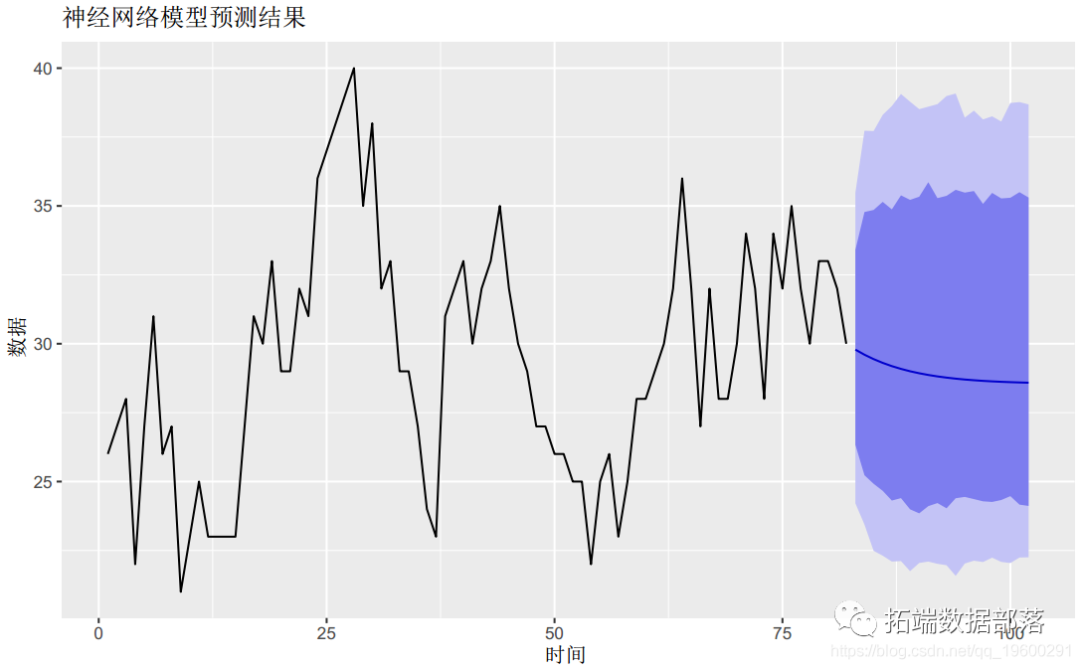
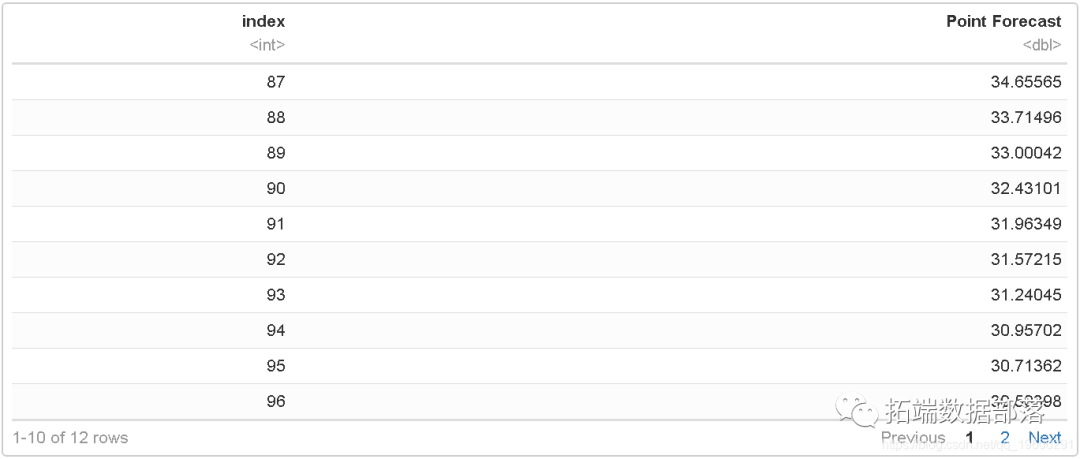
#数据必须为数字,tsclean函数才能正常工作dat%>%dplyr::rename(Date=Week)%>%na.omit()dat_ts = ts(dat["实际数量"]) nn(data, lambda=0.5)Average of 20 networks, each of which isa 1-1-1 network with4 weightsoptions were - linear output unitssigma^2 estimated as0.2705